

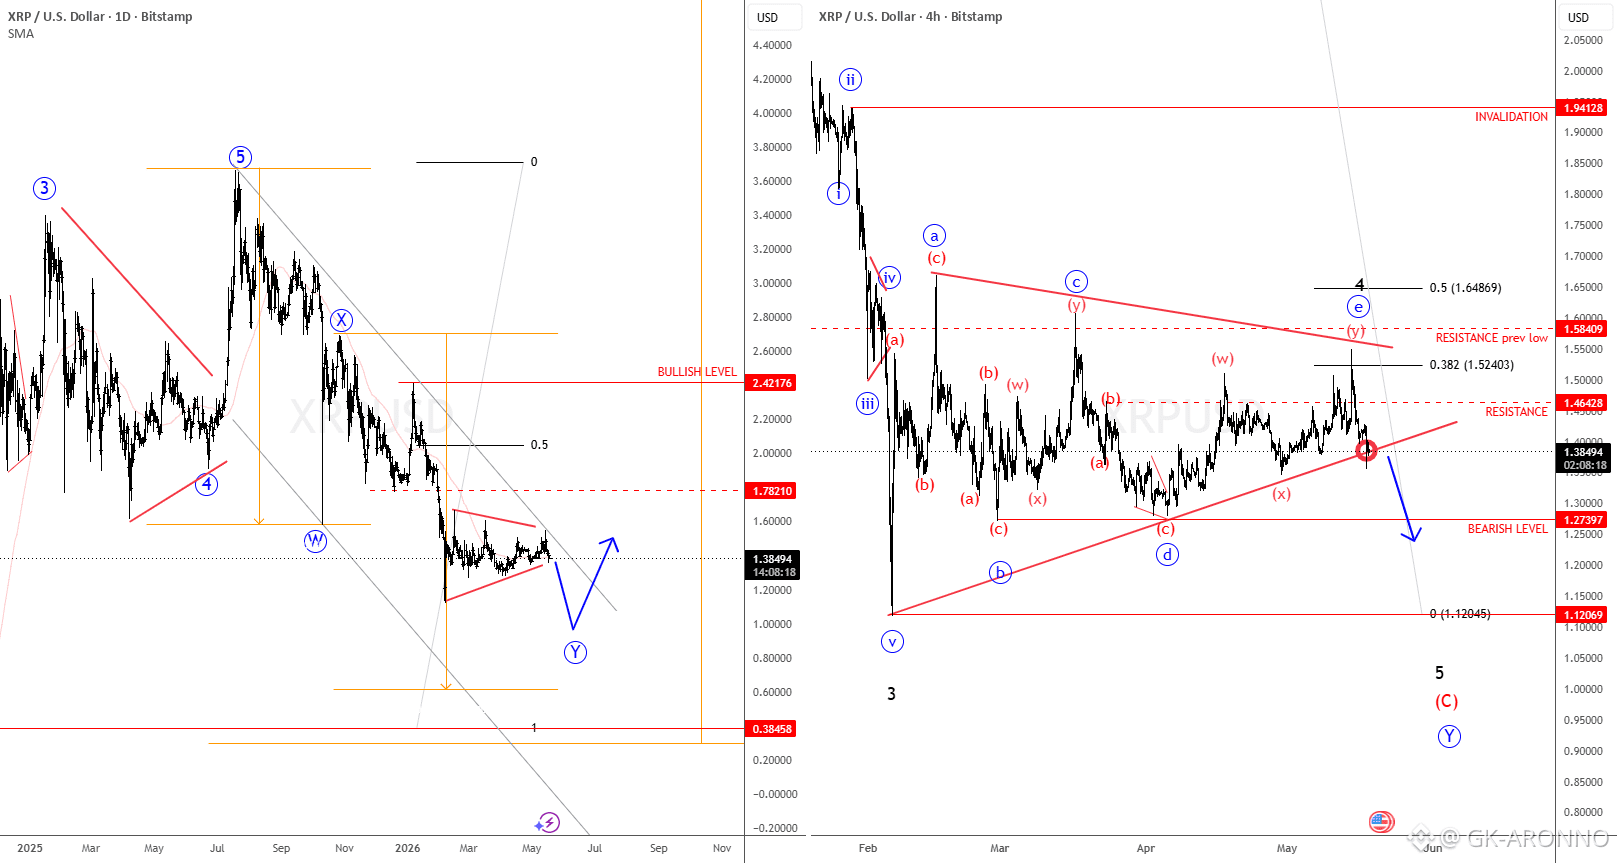
Daily Chart Analysis
On the daily timeframe, XRP remains in a complex WXY corrective structure within wave IV, which now appears to be in its later stages.
Strong support remains near the 1.00 psychological area, where buyers could attempt to establish a rebound. An earlier recovery back above 1.78 would provide the first indication that a meaningful bottom may already be in place.
For a broader bullish reversal confirmation, bulls would need to reclaim levels above 2.42, which would significantly improve the long-term technical outlook.
4H Chart Analysis
Looking at XRP on the 4-hour chart, price action continues to trade impulsively lower within subwave (C) of Y, suggesting there is still room for additional downside before a complete five-wave decline can be confirmed.
Following the recent abc corrective recovery, the broader short-term structure still appears bearish. However, the current sideways consolidation may be developing into a bearish abcde triangle pattern within wave 4.
At the moment, price seems to be completing the final subwave “e” of wave 4 around the 1.50 – 1.60 resistance zone. From there, the market could resume lower toward the 1.00 psychological support level, especially if price breaks beneath both the lower triangle support line and the 1.27 level.
The bearish wave count would become invalid if XRP breaks decisively above the upper triangle resistance and the 1.70 area.
