
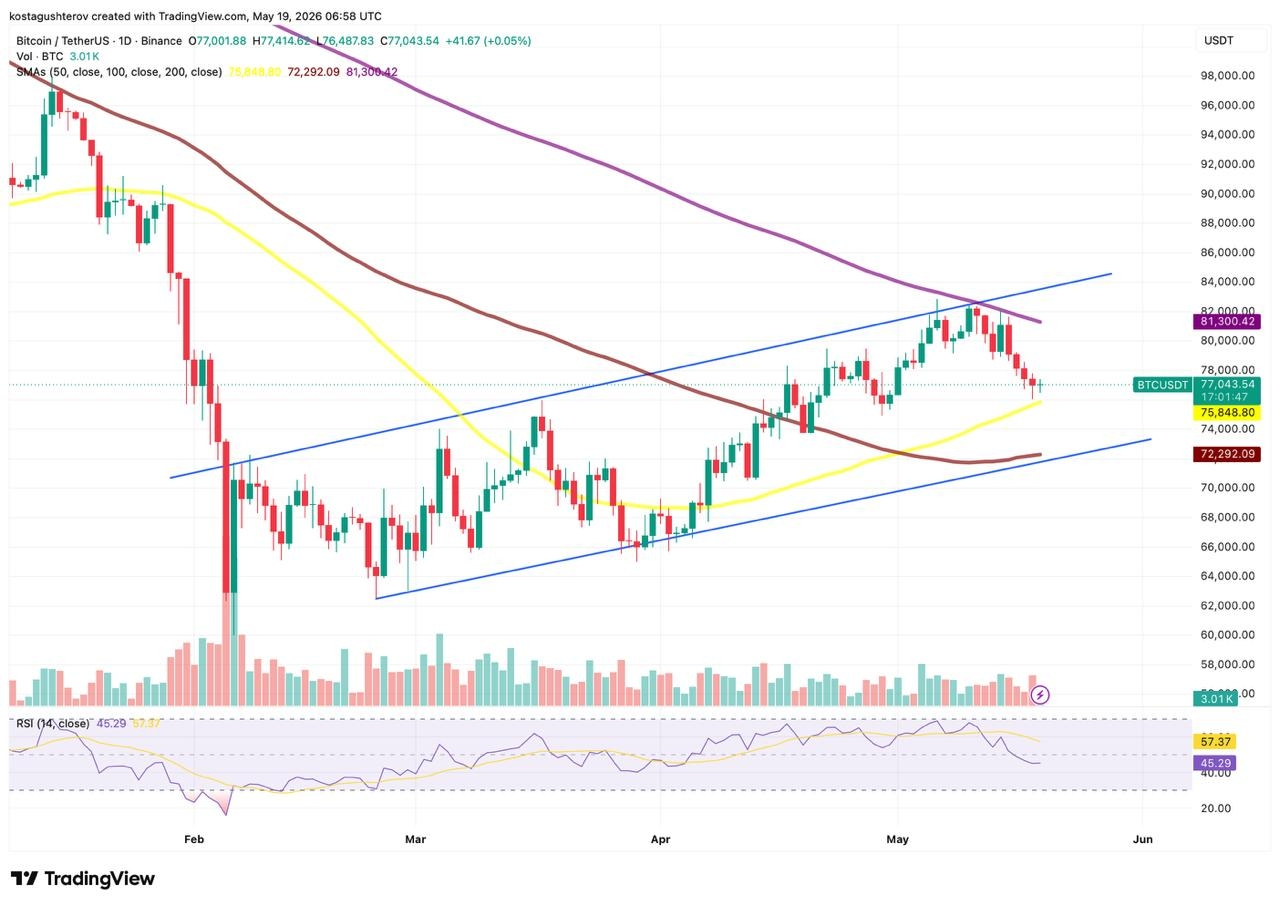
Bitcoin trades at $77,043 on the daily chart as of May 19, halting a decline at the SMA50 and the lower boundary of the ascending channel that has contained price since the March lows.
Key Takeaways
STH Loss to Binance hits 10,200 BTC, first time since March 27.
SMA50 at $75,848 absorbed the drop, channel support intact.
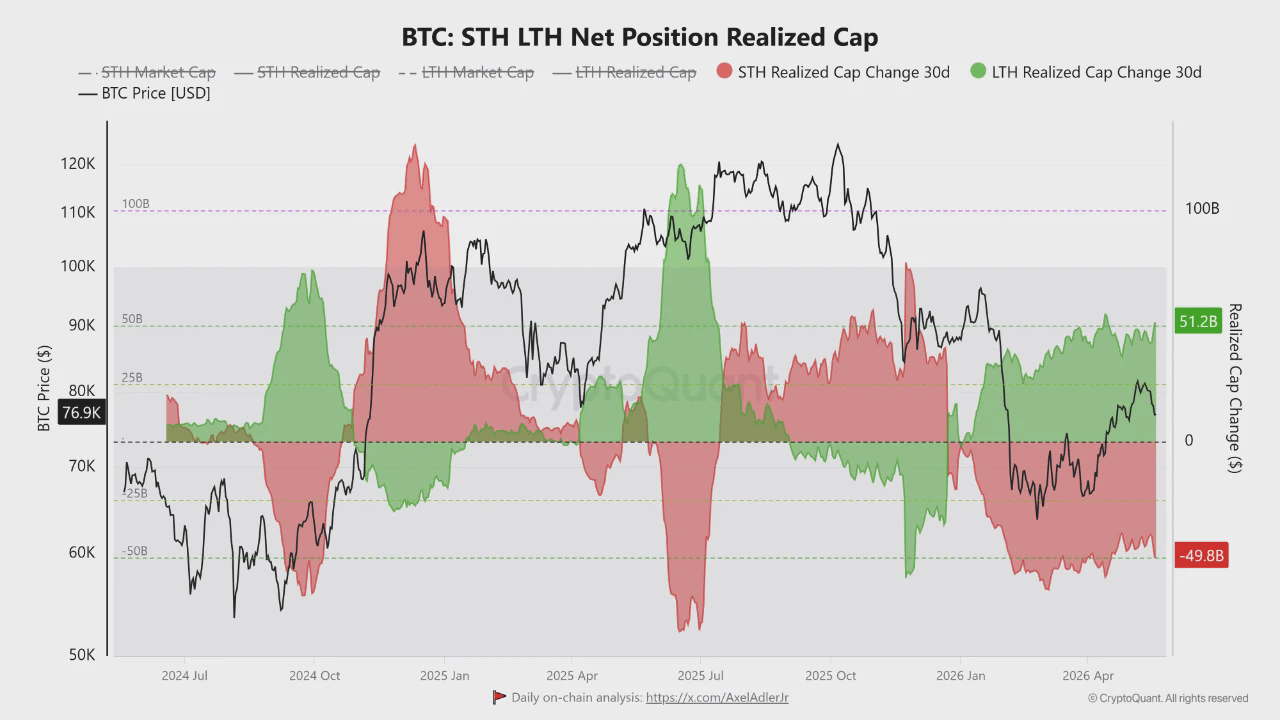
LTH Realized Cap 30D reaches $51.2B, second time above $50B since April 14.
RSI at 45.29, signal at 57.37: momentum negative, structure holding.
What the on-chain data says the sellers were doing
CryptoQuant analyst Amr Taha reported that Short-Term Holder Loss to Binance exceeded 10,000 BTC for the first time since March 27, 2026, with the reading reaching 10,200 BTC. The metric measures coins sent to Binance while already in an unrealized loss position. It does not confirm those losses were realized at the exchange; analytically, it suggests the holders carrying them were positioning to sell rather than to hold through the drawdown. STH Profit to Binance registered only 906 BTC on the same reading, meaning the flow to Binance was overwhelmingly loss-driven.
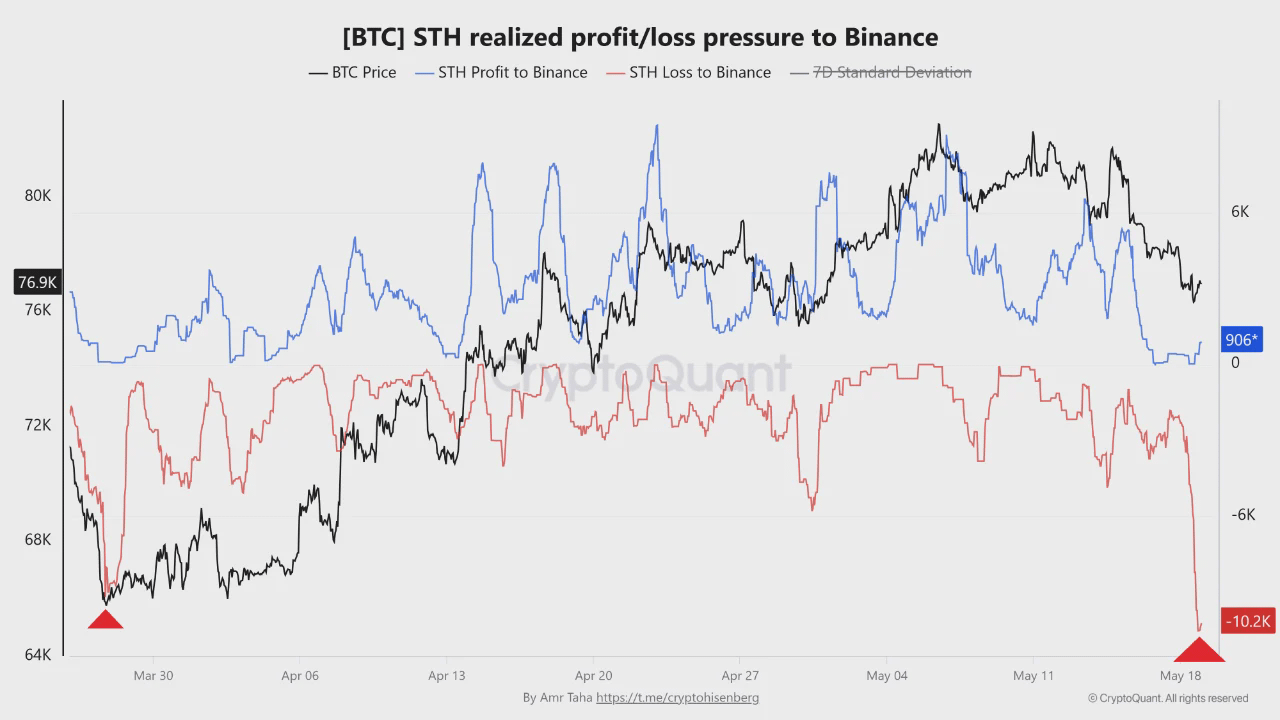 The March reference point establishes a specific cost: during the previous stress zone, with Bitcoin near $66,000, STH Loss to Binance reached approximately 8,600 BTC, and Bitcoin subsequently recovered above $80,000 by May 6. The current reading of 10,200 BTC is approximately 18.6% larger in volume and is occurring at a price level roughly $11,000 higher, meaning the average cost basis of today's capitulating holders is materially higher than those who gave in during March. The stress is larger and more expensive this time.
Why the SMA50 and the capitulation are the same event
The daily chart places the SMA50 at $75,848. Price reached a low of approximately $76,050 yesterday before recovering above $77,000 at the time of writing, sitting $1,195 above the moving average without breaching it. That level has not been tested as resistance since price crossed above it in late February, and yesterday's candle confirmed it is still holding as support.
The 10,200 BTC sent to Binance at a loss is not a signal that the market is breaking; it is the mechanism by which support held, the capitulating sellers provided the liquidity that kept price at the SMA50 rather than through it.
The LTH divergence and what the RSI adds
Taha's second chart introduces the variable that prevents a straightforward bearish reading. The LTH Realized Cap Change 30D has reached approximately $51.2 billion, crossing above the $50 billion threshold for the second time since April 14. The STH Realized Cap Change 30D is simultaneously contracting, shown as a shrinking red area on the right side of the chart. When short-term holders send coins to an exchange at a loss while long-term holder realized cap expands, the market is not in freefall; it is rotating, and the direction of that rotation determines everything that follows.
The price chart's RSI adds a layer of tension to that reading. At 45.29, the RSI sits below the 50 line, confirming net-negative daily momentum. The signal line at 57.37 sits 12.08 points above the RSI itself, a spread that confirms the momentum deterioration is recent and still in progress. The RSI at 45.29 with a signal line 12 points above it describes a market where momentum has already turned negative but structure has not yet confirmed the turn, which is precisely the condition that produces the sharpest moves in either direction.
The SMA200 at $81,300.42 is declining and sits well above current price, a ceiling that would require sustained buying pressure to approach. The SMA100 at $72,292.09 is the level that becomes relevant if the channel support fails on a subsequent test.
Taha notes the divergence between LTH expansion and STH contraction could become an accumulation-versus-capitulation signal for the next major move if Bitcoin stabilizes near current levels, while acknowledging the March-to-May rebound pattern is not guaranteed to repeat. Whether the channel support absorbs the next test with the LTH cap continuing to expand confirms the rotation thesis, or the 10,200 BTC loss flow proves to be the opening of a larger wave rather than its peak, is the question the current data poses without yet answering.