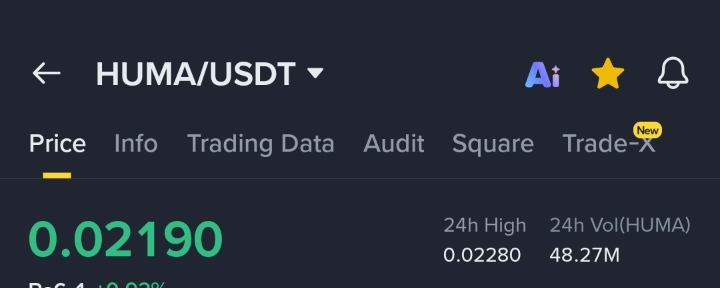
$HUMA is showing short-term bullish momentum on the 15m chart. The price is currently around 0.02190, moving above the recent support zone near 0.02176–0.02180. Buyers stepped in strongly after consolidation, pushing the price close to the local resistance at 0.02191–0.02200.
The MA60 line is below the current price now, which is a positive sign for intraday momentum. Volume also increased during the recent upward move, showing active buying interest instead of weak pump action.
Key Levels
Resistance: 0.02191 → 0.02220
Support: 0.02180 → 0.02167
Market View
If HUMA breaks and holds above 0.02200, it may continue toward 0.02220–0.02250.
If volume drops and price fails near resistance, a pullback toward 0.02180 is possible before the next move.
Overall Sentiment
Short-term trend looks bullish with improving momentum, but traders should watch volume carefully because this is still a low-priced volatile coin. A breakout confirmation above resistance would strengthen bullish continuation.