The cryptocurrency market is currently flashing classic signs of institutional price delivery. Bitcoin ($BTC /$USDT ) has spent the last week carving out a highly disciplined, textbook bearish structure. For professional traders tracking smart money footprints rather than retail momentum, the current consolidation phase offers deep insights into market architecture and upcoming volatility.
Here is a comprehensive structural breakdown of Bitcoin’s price action, the logic behind its recent behavior, and the high-probability setups we are monitoring.
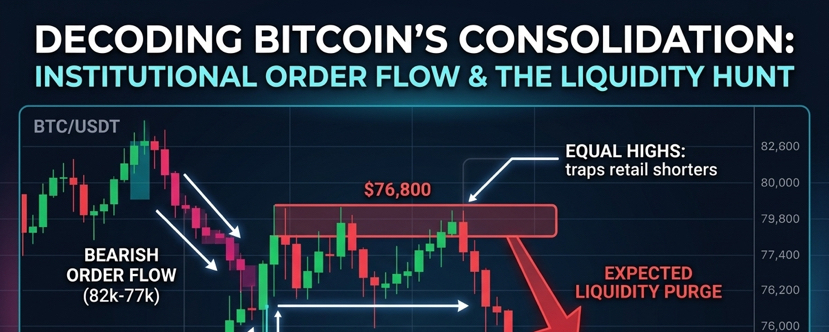
1. The Macro View: Understanding Bearish Order Flow
Over the past week, Bitcoin has exhibited a strict institutional distribution pattern. Every time the price dropped from a psychological level, it completely left it behind without looking back. We witnessed the market abandon major key levels sequentially: from $82k down to $81k, $80k, $79k, $78k, and recently $77k.
In Smart Money Concepts (SMC), this behavior indicates Premium vs. Discount Pricing Mitigation. The institutions currently commanding the market have shifted their order blocks downward. For major entities, retesting $77k or higher right now represents a "premium" (expensive) price that they have no interest in filling until a major internal discount pool is mitigated.
2. Technical Breakdown: Market Structure Shift & Compression
Looking closely at the recent 1-Hour chart dynamics, two structural elements stand out:
Market Structure Shift (MSS): After tapping a local high near $77,755, the market suffered an aggressive drop, piercing through old swing lows to hit $76,019. This violent break represents a Bearish Change of Character (CHoCH), signaling that immediate control has shifted from buyers to sellers.
The Liquidity Pool (Equal Highs): Following the bounce from $76k, the price failed to reclaim the old highs, creating a series of relatively equal peaks near $77k. This engineering of "Trendline Liquidity" has trapped retail shorters who view this as standard double/triple top resistance, placing their Buy Stop Liquidity (BSL) pools directly above these peaks.
Compression Phase: Currently, the price is tightly consolidating around the $76,800 corridor. The major Moving Averages (MA5, MA10, and MA30) are tightly flattening through the candles, which is a classic precursor to a highly volatile expansion move.
3. The Predictive Analysis: The Last High-Power Dump
Markets rarely reverse from a tight, prolonged consolidation corridor without a violent trigger. Based on algorithmic data tracking and historical wick behavior, a high-probability scenario is forming: A final, high-power purge.
Roughly a month ago, Bitcoin left a sharp institutional sweep wick just below the $74k support zone before aggressively reversing. Because retail traders anchored their structural stop-losses directly underneath that historic zone, a massive cluster of Sell-Side Liquidity (SSL) is sitting completely unmitigated.
The $1,500 – $2,000 Dip Calculation
Given the current distribution phase at $76,800, a standard, volatile institutional stop-hunt would require a rapid 2% to 2.5% flush. Mathematically, this translates to an approximate $1,500 to $2,000 price drop from the current range.
This projected flush will likely targets the high-liquidity interest zones between $75,300 and $74,800, effectively sweeping the old accumulated order books and capturing cheap liquidity before any macro trend reversal can take place.
4. Execution Strategy: The Wait and Watch Framework
In conditions heavily dominated by clear algorithmic order flow, patience is a position. The optimal approach is divided into two strict execution models:
Strategy A: The Manual Liquidity Sweep Confirmations
The Directive: Allow the market to execute the anticipated $1,500–$2,000 dip without jumping in early.
The Trigger: Monitor the $75,300–$74,800 demand clusters. We are looking exclusively for a sharp intraday rejection—a long tail/wick leaving the candle bodies closing above key support.
The Confirmation: Wait for a lower-timeframe (5m/15m) Market Structure Shift (CHoCH breaking the minor lower high) to validate institutional accumulation before placing long positions.
Strategy B: Quantitative Automated DCA Deployment
For hands-free risk mitigation, a conservative Futures Dollar-Cost Averaging (DCA) bot framework can be deployed within the capital buffer. By utilizing a small base order at current pricing and setting mathematically spaced safety orders down into the $75,300 and $74,800 deviation levels, a trader can seamlessly average their entry price, turning the expected volatility into optimized positioning.
Conclusion
Bitcoin is completing the final chapters of its current range contraction. The smart money path of least resistance points toward a rapid, liquidity-clearing drop to collect old resting orders before the trend can structurally shift. Until the market delivers this necessary volume expansion, maintaining capital preservation and observing the charts remains the ultimate professional edge.


