
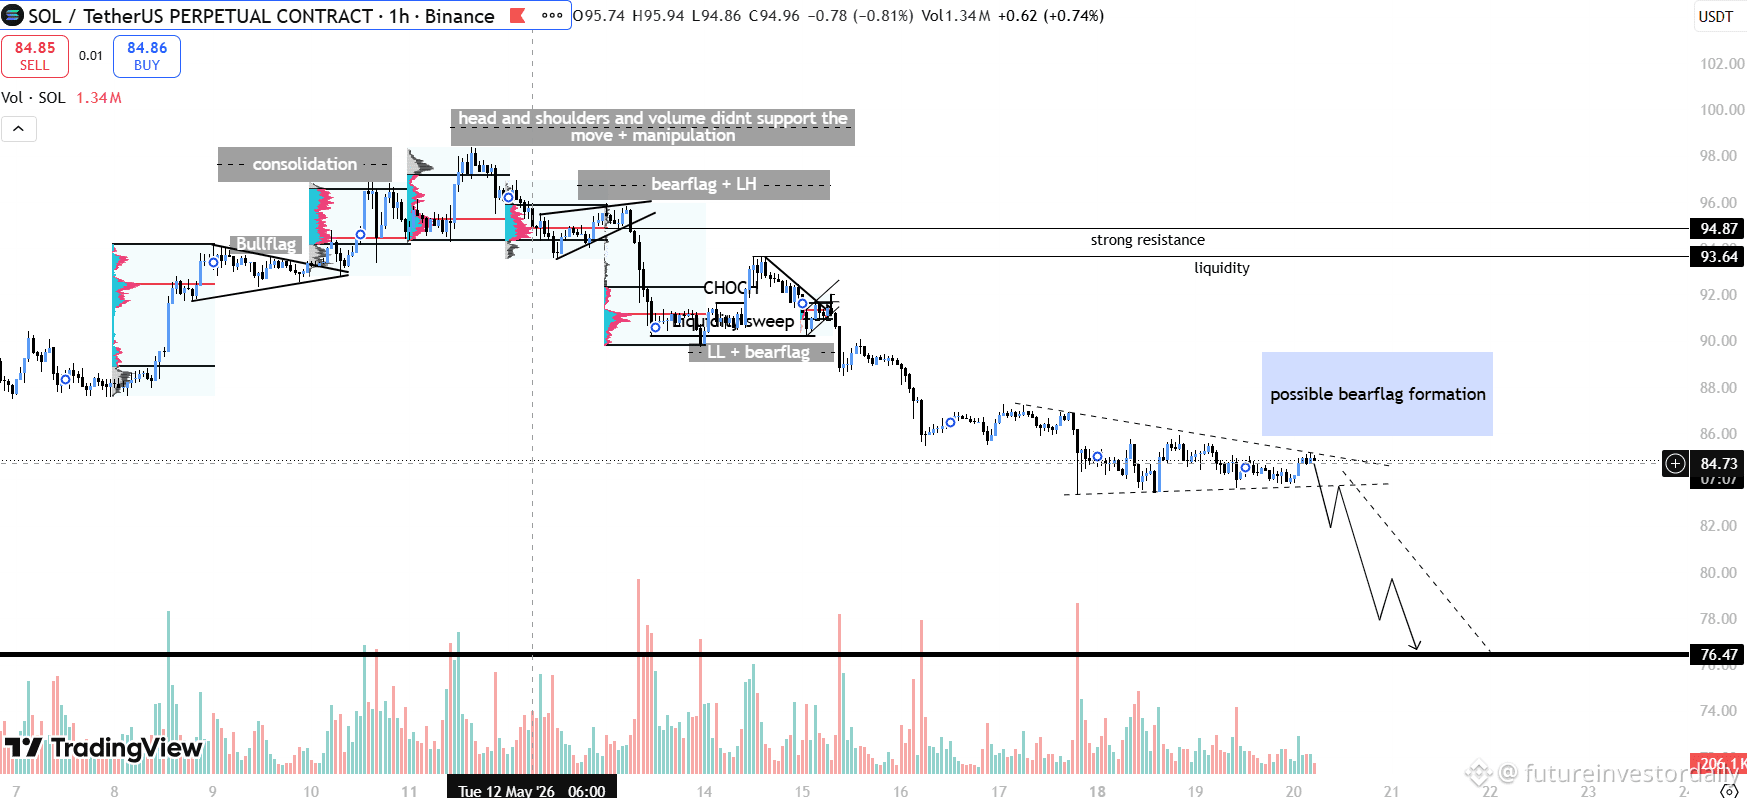
$SOL on 1-hour timeframe is currently showing a textbook continuation of bearish market structure. The chart highlights repeated failed bullish attempts, weakening momentum, and a developing bear flag pattern that could lead to another significant downside move if support fails.
Market Context
After a strong rally toward the 98–99 USDT region, SOL began showing signs of exhaustion. Price action formed a classic head-and-shoulders structure, while accompanying volume failed to confirm higher highs. This divergence between price and participation often signals that institutional buying pressure is fading.
The rejection from the upper resistance zone around 94–95 USDT marked the beginning of a broader breakdown phase.
Key observations from the chart:
Repeated lower highs after the top formation Weak breakout attempts Increasing bearish continuation patterns Liquidity sweeps followed by aggressive selloffs Declining volume during consolidation phases
Together, these characteristics suggest that sellers remain in control.
Breakdown of the Technical Structure
Early Bullish Continuation — The Bull Flag
The chart initially displayed a bullish continuation setup in the form of a bull flag. Price consolidated after an impulsive move upward and successfully broke out, driving SOL toward the 98 USDT area.
However, this move lacked sustainable volume expansion.
This was the first warning sign that momentum might not hold.
Head-and-Shoulders Reversal
Near the local top, the chart formed a visible head-and-shoulders pattern:
Left shoulder formed during initial consolidation Head created at the peak near 98 Right shoulder failed to reclaim highs
The neckline eventually broke, triggering a market structure shift from bullish to bearish.
This breakdown was reinforced by declining buy-side volume and immediate rejection after each recovery attempt.
CHOCH and Liquidity Sweep
A major point on the chart is labeled CHOCH (Change of Character), which traders often use to identify the transition between bullish and bearish order flow.
Before continuation downward, price performed a liquidity sweep:
Short-term highs were briefly reclaimed Late buyers entered Price immediately reversed lower
This type of move is common in leveraged perpetual markets where liquidity hunting occurs before directional expansion.
Current Structure: Possible Bear Flag
The most important area now is the current consolidation between roughly 84–86 USDT.
The chart outlines a descending channel that resembles a developing bear flag.
A bear flag typically forms:
After a sharp impulsive decline During weak upward or sideways consolidation Before continuation lower
The declining slope and compressed price action indicate that buyers are struggling to regain momentum.
If the lower boundary breaks decisively, the next major downside target shown on the chart is approximately:
76.47 USDT
That level appears to be a major support zone and likely liquidity area.
Key Levels to Watch Resistance 93.64 USDT — liquidity and prior breakdown area 94.87 USDT — strong resistance and invalidation zone
A reclaim above these levels would weaken the bearish thesis significantly.
Support 84 USDT region — current short-term support 76.47 USDT — major downside target Volume Analysis
Volume behavior strengthens the bearish interpretation:
Stronger volume spikes occurred during selloffs Consolidation phases showed declining participation Recovery attempts lacked aggressive buying interest
This imbalance suggests that sellers remain dominant while buyers are mostly reactive rather than initiating trend reversals.
Trading Psychology Behind the Move
This chart reflects a common market cycle:
Expansion phase attracts breakout traders Distribution occurs near highs Smart money exits while retail continues buying Liquidity grabs trap late participants Trend reverses and accelerates downward
The annotated “manipulation” note on the chart refers to these false breakout dynamics and liquidity engineering often seen in perpetual futures markets.
Outlook
As long as SOL remains below the 93–95 resistance zone, the short-term structure favors continued downside pressure.
The bear flag currently developing could become the trigger for another leg lower if:
volume expands during breakdown, support at 84 fails, and bearish momentum accelerates.
However, if buyers reclaim resistance with strong participation and invalidate the lower-high sequence, the bearish setup could fail and shift market sentiment again.
#solana #bearmarket
