Yesterday started in a very interesting way for Gold.
After the Asian session lows, price began to rebound, but the recovery looked overlapping and corrective in nature rather than impulsive. Because of that, when Gold started dropping again from above the 4500 zone, it initially looked like the bearish continuation I had been waiting for.
However, once price reached the 4468 support area, something changed.
A very aggressive rebound followed, and fortunately my pending sell order was placed higher, above the 4520 zone, near the second resistance area. That gave me enough time to reassess the situation, remove the order, and avoid getting caught in what quickly became a violent squeeze higher.
And honestly, this is a very important reminder: sometimes good trading is not about catching the move. Sometimes it is simply about avoiding unnecessary damage 🙂
Going further, Gold didn’t stop at the initial rebound.
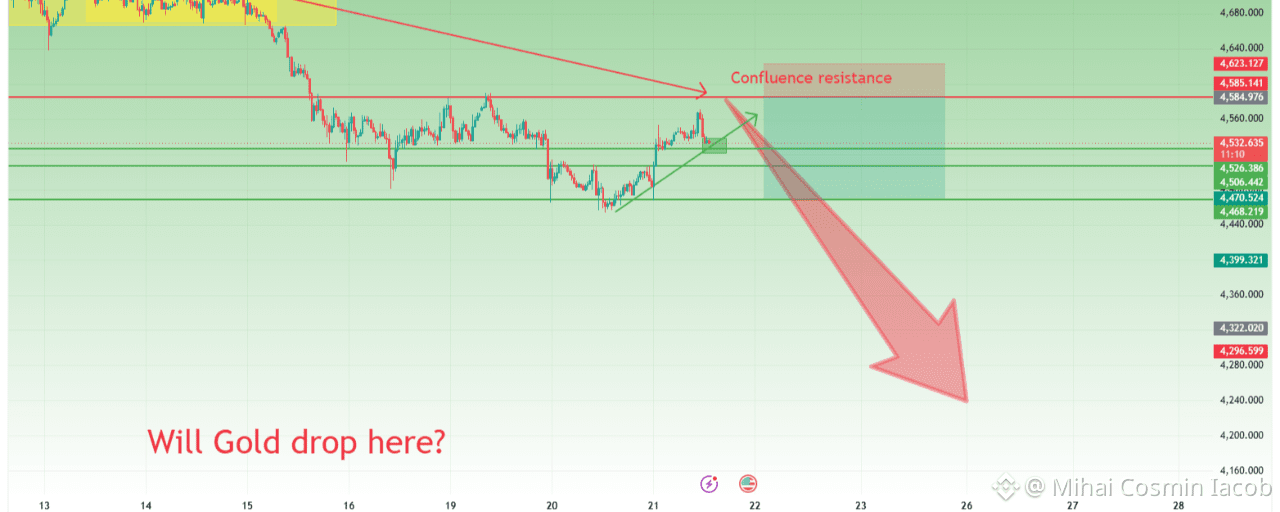
The market managed to break above the 4520 resistance area and overnight printed a local high around 4571, stopping just below the major confluence resistance near the 4600 zone.
Now, of course, this is where the market becomes psychologically interesting.
Bulls immediately scream: ➡️ “Reversal!”
Bears answer: ➡️ “Just another spike!”
So instead of choosing sides emotionally, let’s try to read the structure objectively.
Looking at the Market From the Bottom Up
If we analyze the chart from the lows upward, there are definitely bullish arguments.
We can clearly see repeated rejection below the 4500 zone:
three separate dips below the level all aggressively reversed with the latest rebound breaking decisively back above the 4510–4520 resistance area
And at the time of writing, price is still holding above that reclaimed zone.
From this perspective, one could absolutely argue that Gold may have completed at least the current bearish leg.
But From the Top Down, the Picture Changes
When we shift perspective and analyze the broader structure from top to bottom, things suddenly become far less bullish.
Yes, Gold rallied roughly 1000 pips from the lows.
But in this kind of volatility, 1000 pips can easily become noise rather than a true structural change.
And technically speaking, very little has actually changed on the higher timeframes.
The sequence of lower highs remains fully intact. Not partially intact. Completely intact.
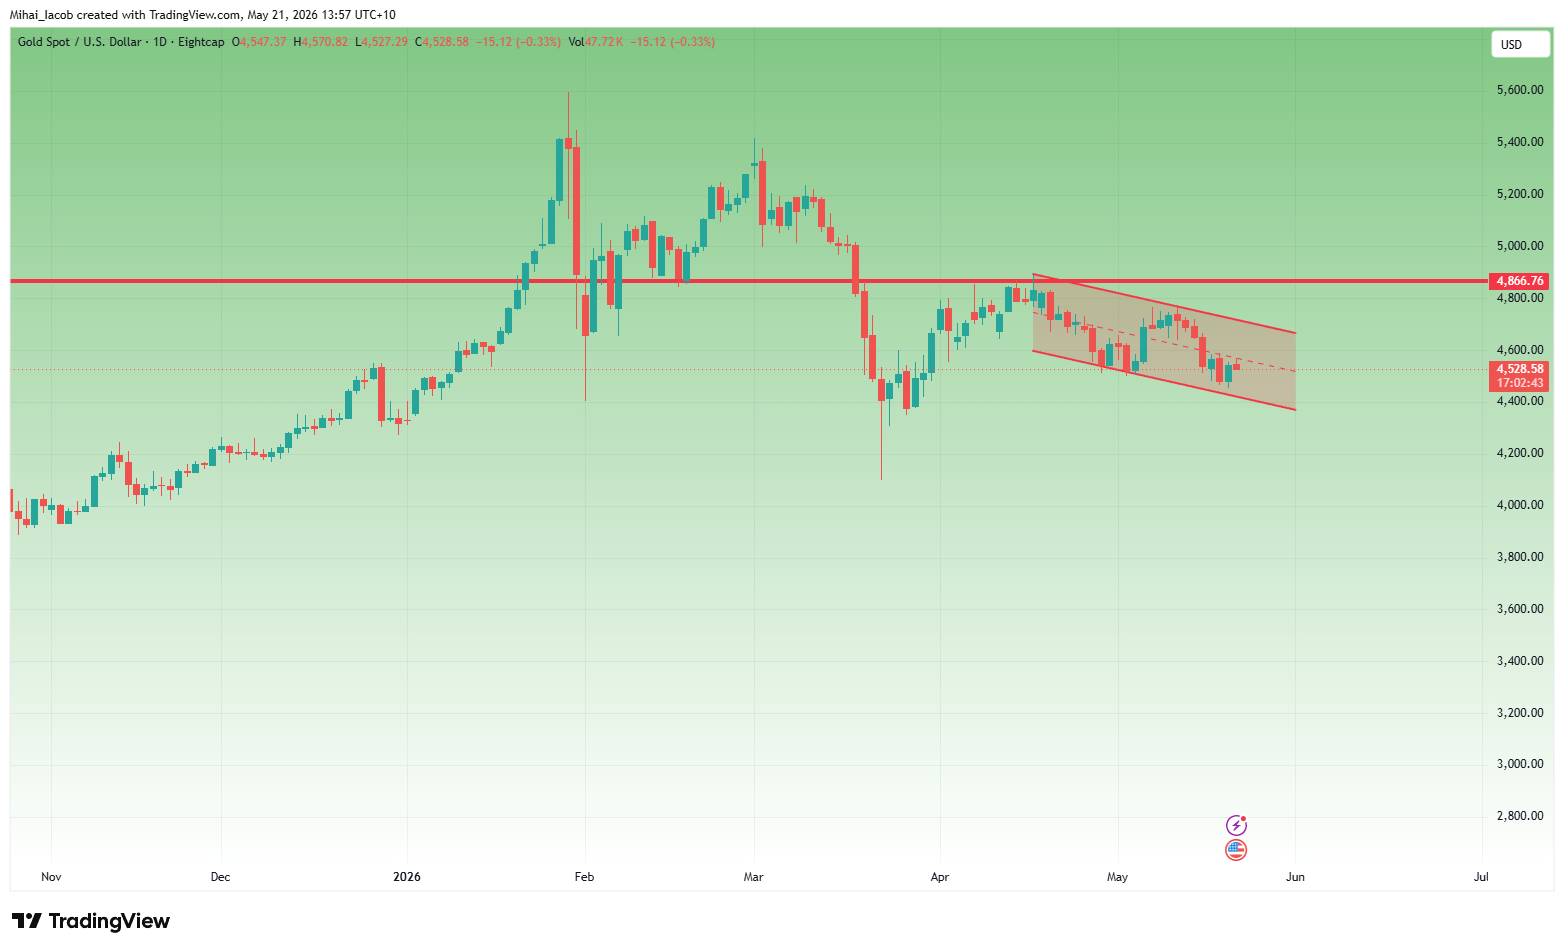
Since the rejection from the 4900 resistance zone, Gold has been trading inside a falling channel structure.
And here comes the important detail: yesterday’s rally didn’t even manage to break above the median line of that channel.
That matters.
Because strong reversals usually reclaim structure aggressively. Weak rebounds usually stop inside the structure that caused the drop in the first place.
What Would Actually Turn Gold Bullish?
This is where I think many traders confuse volatility with structural change.
For Gold to genuinely shift bullish again, two important technical conditions would need to happen:
Negation of this entire week’s drop
Meaning: ➡️ sustained recovery above the 4600 zone
Break above the falling channel resistance
Because only then would the entire decline start resembling a bullish flag rather than a continuation structure.
And realistically, that second condition happens only above the 4700 zone.
Until then, for me, Gold remains structurally bearish.
Not because I “want” it lower. But because the higher timeframe still says so.
Trading Plan
Going forward, my approach remains relatively simple: ➡️ I continue looking to sell rallies rather than chase upside spikes.
Preferably, I want those entries near major confluence resistance areas where the risk-reward ratio remains healthy.
Because in environments like this, direction matters… but entry location matters even more.
And Gold right now feels less like a clean trend… and more like a psychological war designed to punish traders with weak patience 🚀
#PostonTradFi #XAUUSD