
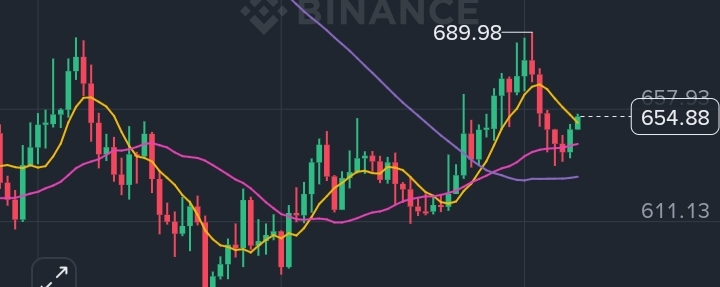
Here is the technical analysis and potential entry strategy for BNB/USDT based on the 1-Day (1D) chart from your screenshot.
1. Market Overview & Trend Analysis
Current Price: $654.88 (+0.93%)
Price Action: The asset recently hit a local low of $570.31, followed by a strong recovery to a high of $689.98. Currently, the price is undergoing a healthy consolidation/pullback after facing resistance near the $690 level.
Moving Averages (MA): * MA(7) - Yellow: $652.28
MA(25) - Pink: $643.47
MA(99) - Purple: $629.80
Analysis: The price is currently trading above all three major moving averages. The MA(7) is holding tightly as immediate dynamic support, and the overall alignment (MA 7 > MA 25 > MA 99) indicates a bullish structure on the daily timeframe.
2. Indicator Analysis (MACD & Volume)
Volume: The volume bars show a steady presence of buyers during the upward move, though it has cooled down slightly during this minor consolidation phase.
MACD: The MACD lines are above the zero line, indicating baseline bullish momentum. However, the histogram shows light red bars with a value of -1.99, suggesting a brief cooling-off period or short-term bearish crossover. This means the price might consolidate or slightly dip before the next leg up.
3. Potential Trade Entry Points (DCA Strategy)
Given the bullish daily structure but short-term consolidation, a Spot DCA (Dollar-Cost Averaging) or layered entry approach is the safest strategy here.
Entry Zone 1 (Current Market / Aggressive): $648 - $654
Rationale: This is the immediate support area where the MA(7) resides. If the daily candle closes above $652, it proves buyers are defending this level for a quick continuation.
Entry Zone 2 (Conservative / Strong Support): $638 - $644
Rationale: This aligns perfectly with the MA(25) at $643.47. If the price breaks down from the current level, this zone offers a much safer risk-to-reward ratio for a bounce.
Entry Zone 3 (Major Pullback / Ultimate Support): $625 - $630
Rationale: This is where the MA(99) sits ($629.80). It is unlikely to hit unless the broader market (BTC) dumps, but it represents an incredibly strong historical demand zone.
4. Targets & Stop Loss
Take Profit 1 (Short-term): $685 - $690 (Retesting the recent high)
Take Profit 2 (Mid-term): $720 - $750 (Psychological resistance and open space)
Stop Loss (For tight trading): A daily close below $620 (Invalidates the current bullish structure). If you are doing long-term Spot DCA, you can skip a tight stop loss and hold through the swing.
