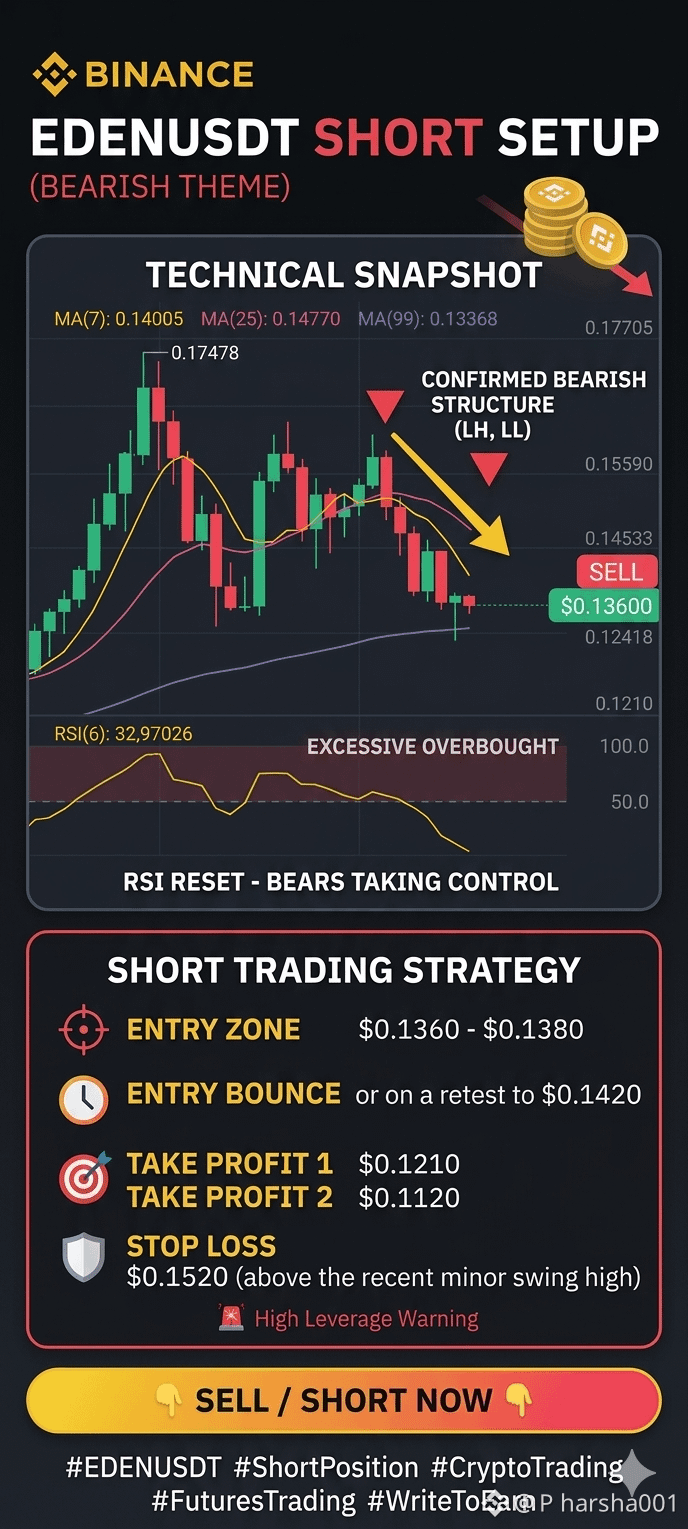
EDENUSDT has shown a massive parabolic rally recently, but the charts are now signaling a strong exhaustion from the buyers. It looks like the perfect time to look for short setups as a healthy correction is highly likely.
Here is a breakdown of the technical analysis across multiple timeframes:
🔍 Technical Breakdown
1️⃣ Extreme Overbought Condition (1D & 4H Charts)
On the Daily (1D) and 4-Hour (4H) charts, the RSI (6) reached an extreme overbought level of 97.17.
An RSI reading this high is highly unsustainable and usually precedes a sharp downside correction as early investors start taking profits.
2️⃣ Strong Resistance Rejection at $0.17478
The price aggressively pumped to a 24h high of $0.17478 but faced heavy rejection, leaving a massive upper wick (shadow) on the 4H and 1D candles.
This shows that sellers have actively entered the market at the top, pushing the price back down significantly.
3️⃣ Short-Term Bearish Breakdown (1H & 15M Charts)
1-Hour Chart: The price has broken down below the MA(7) (Yellow line) and is currently struggling to hold the MA(25) (Purple line) support around $0.1333.
15-Minute Chart: We can clearly see a Lower High and Lower Low structure forming. The short-term trend has officially shifted to bearish, and the RSI has dropped down to 32, showing heavy selling momentum.
🎯 Trading Strategy (Short Setup)
Trade Direction: Short (Sell)
Entry Range: Around current price ($0.1360 - $0.1380) or on a minor relief bounce toward $0.1420.
Targets (Take Profit): * 🎯 Target 1: $0.1210 (Recent 1H support level)
🎯 Target 2: $0.1120 (Major liquidity zone)
🎯 Target 3: $0.0980 (To retest the 4H Moving Average support)
Stop Loss (Risk Management): Above the recent minor swing high at $0.1520 or tighter above $0.1460 depending on your leverage.
Let's capitalize on this correction and stack some good gains! 💰📉
#EDENUSDT #TechnicalAnalysisnalysis #WriteToEarn