
1. Monthly Chart (1M) – Shooting Star (Still in Formation)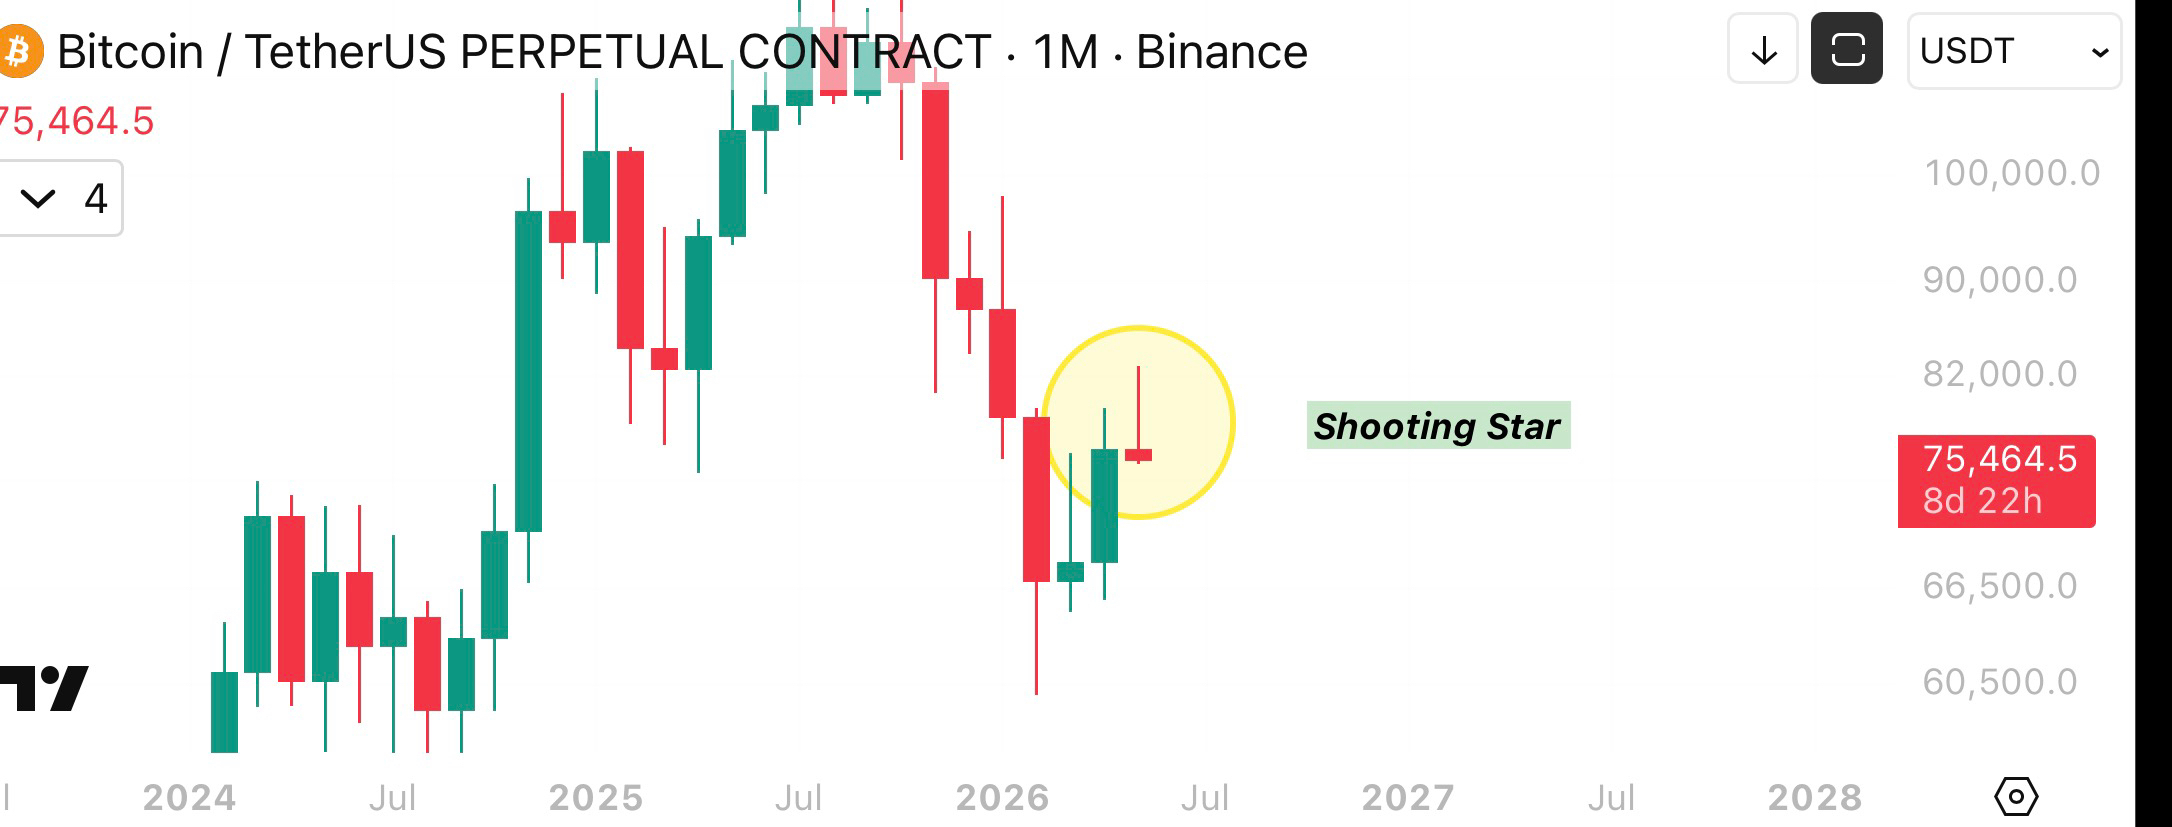
Pattern: Classic Shooting Star: small body near the low of the month with a long upper wick.
Context & Impact:
Formed at the peak of a strong month rally.
The long upper wick shows buyers pushed prices higher intraday, but aggressive selling rejected it, closing near the lows.
Important note: This monthly candle is still forming (8 days + remaining). Current price sits around $75,400–75,500, well below the month’s high.
Price Effect So Far:
The Shooting Star has already triggered a notable pullback from the ~82k–83k zone. If the month closes as a red candle (especially confirming the Shooting Star), it will act as a major bearish reversal signal on the highest timeframe , often marking significant cycle tops or deep corrections. Watch the final days closely.
2. Weekly Chart (1W) – Bearish Engulfing Candle
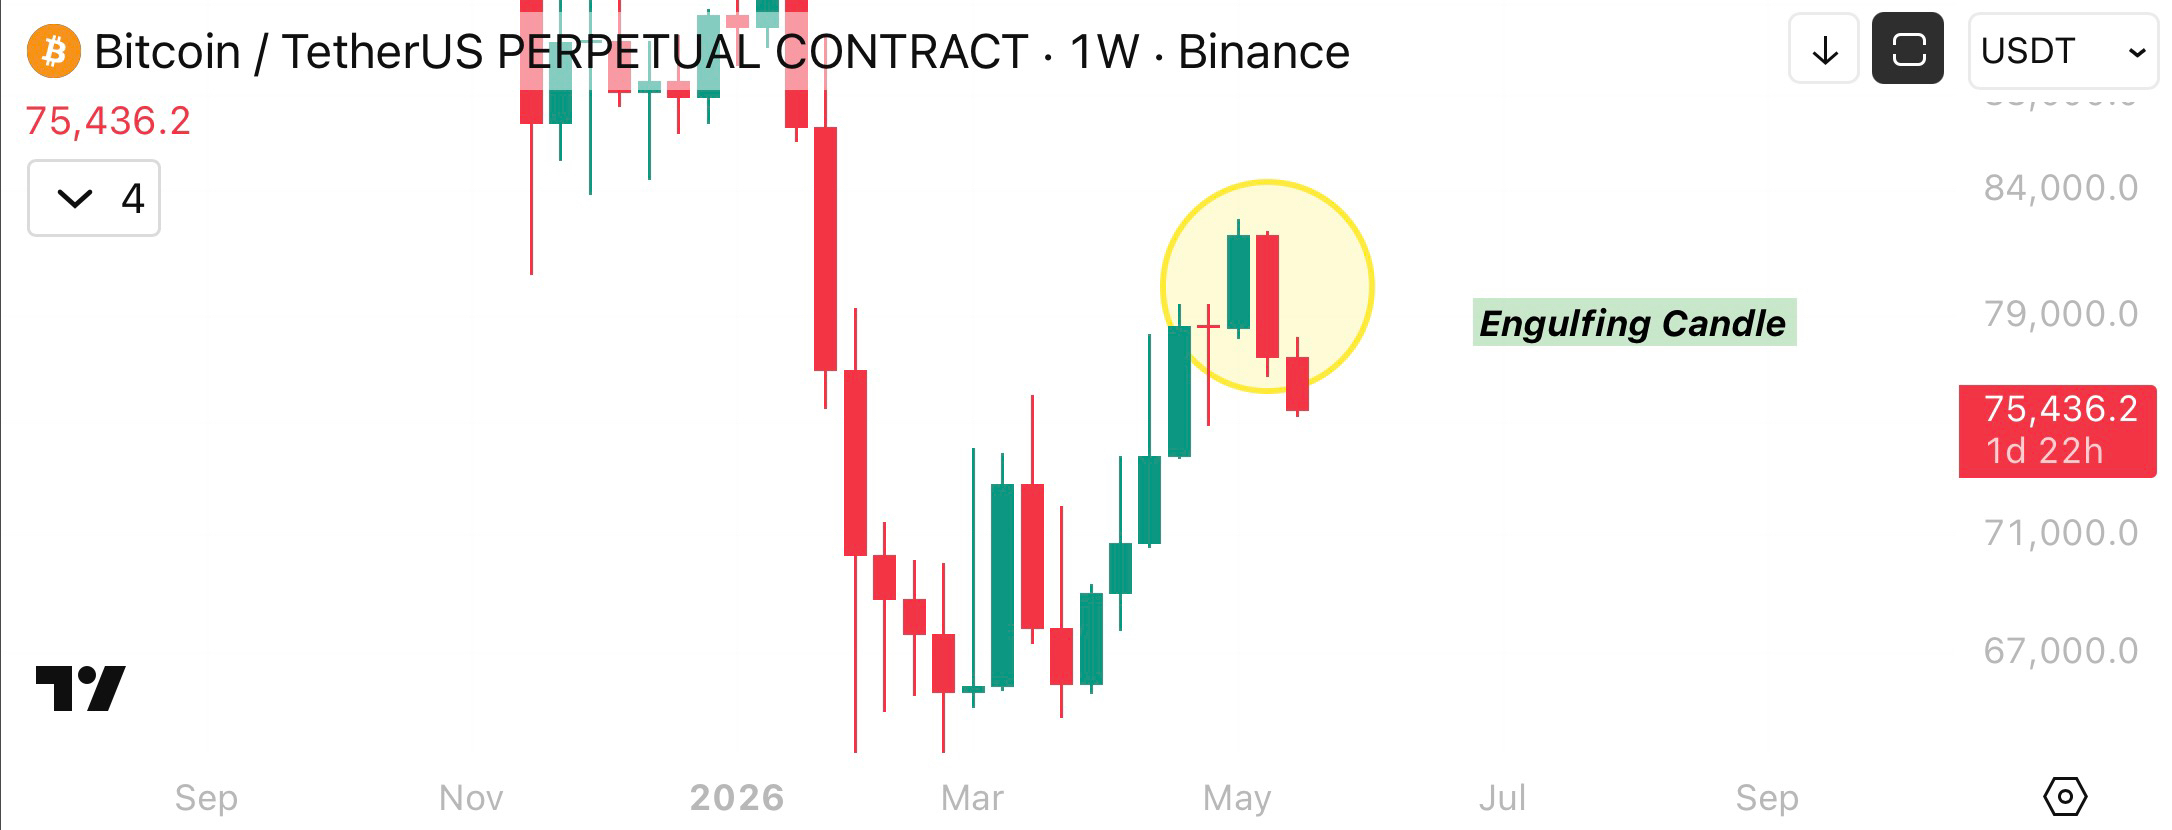
Pattern: Strong Bearish Engulfing (large red candle fully swallowing the previous green candle).
Context & Impact:
Appeared in the May 2026 area after a recovery rally from March–April.
Demonstrated clear seller dominance, erasing the prior week’s gains in one decisive move.
Price Effect:
This pattern successfully capped the short-term rally. BTC topped out near the circled zone (~79k–80k) and has since corrected toward the current $75,400 level. Weekly engulfing patterns are highly reliable, especially when aligning with higher-timeframe warnings.
3. Daily Chart (1D) – Multiple Bearish Signals
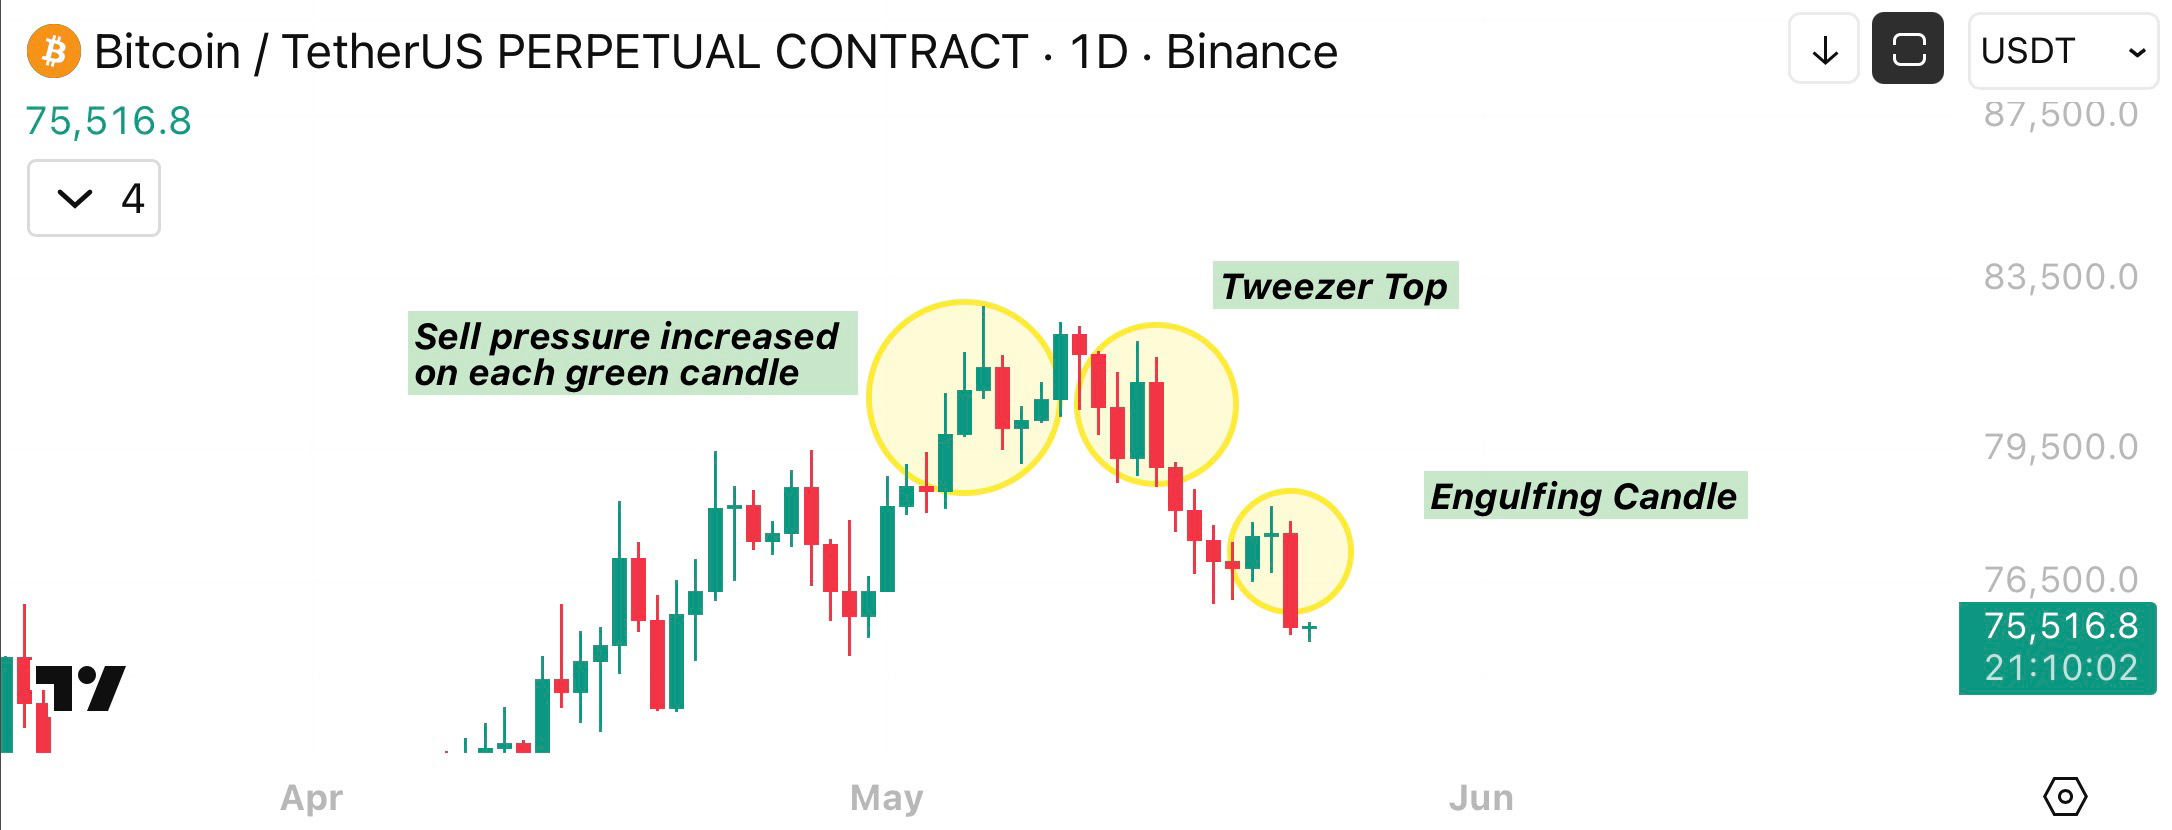
Patterns Highlighted:
Increased Sell Pressure on Green Candles (mid-May): Repeated long upper wicks on green candles showed buyers struggling.
Tweezer Top: Two candles with highs at nearly the same level, classic double-top rejection.
Bearish Engulfing Candle: Final confirmation with a strong red candle swallowing the prior green.
Price Effect:
These daily patterns created a textbook distribution phase at resistance. They accelerated the breakdown from the ~79k+ area down to current levels (~75.5k). The combination provided clear tactical short entries that played out well.
Overall Analysis & Takeaway:
The patterns align beautifully from higher to lower timeframes:
Monthly Shooting Star → Big-picture bearish warning (still developing)
Weekly Engulfing → Reversal confirmation
Daily signals → Execution and acceleration of the move lower
This multi-timeframe bearish alignment has already driven a ~8–10%+ correction. With the monthly candle still open, the final close will be critical, a confirmed red monthly candle would strengthen the bearish case significantly.
Current Price: ~$75,400–75,500 USDT
This is not a financial advice. DYOR
