SOL on the 1D chart still looks overall bearish to neutral because:
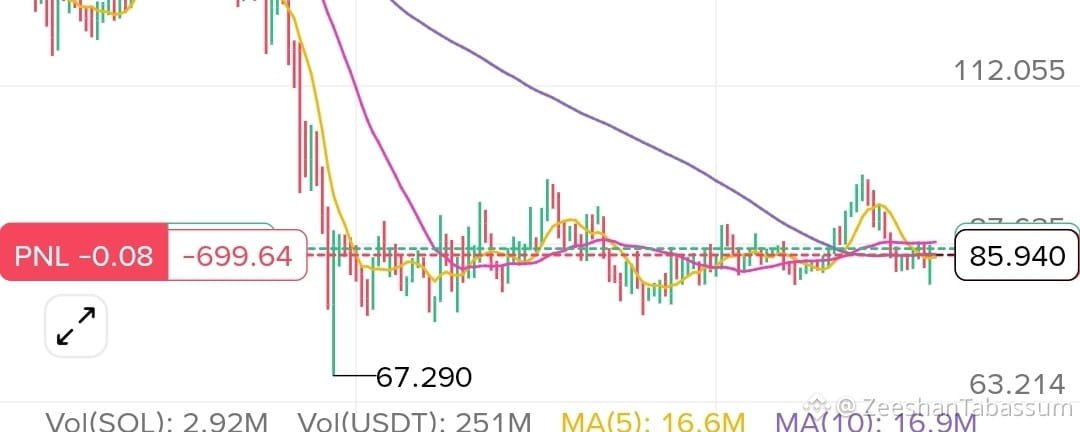
Current price: 85.95
MA(25): around 87.95
MA(99): around 86.02
Price is trading below or around the major moving averages, which shows buyers are still not fully in control.
Main observations from the chart:
67$ acted as a very strong bottom support
Since then, SOL has been moving sideways between 81$–88$
Volume is average, no strong breakout volume yet
87.5$ is the main resistance
81$–82$ is the important support zone
Possible next moves:
If SOL breaks above 87.5$ strongly:
Next targets can be:
92$
96$
then possibly 100$
If 81$ support breaks:
Price may drop toward:
78$
74$
and in extreme weakness, even retest 67$
Current market structure:
Right now it looks more sideways-to-bearish unless SOL gives a clean daily breakout above 88$. The current zone can also produce fake pumps and fake dumps.
Trading view:
Long looks safer only above 88$
Short becomes stronger below 81$
Trading in the middle range is risky because the market is choppy.
Same as the case in trading on BTC or all other heavy Giants. 💥
 BTC67,653.33-5.17%
 SOL77.03-3.55%
 ETH1,925-2.38%