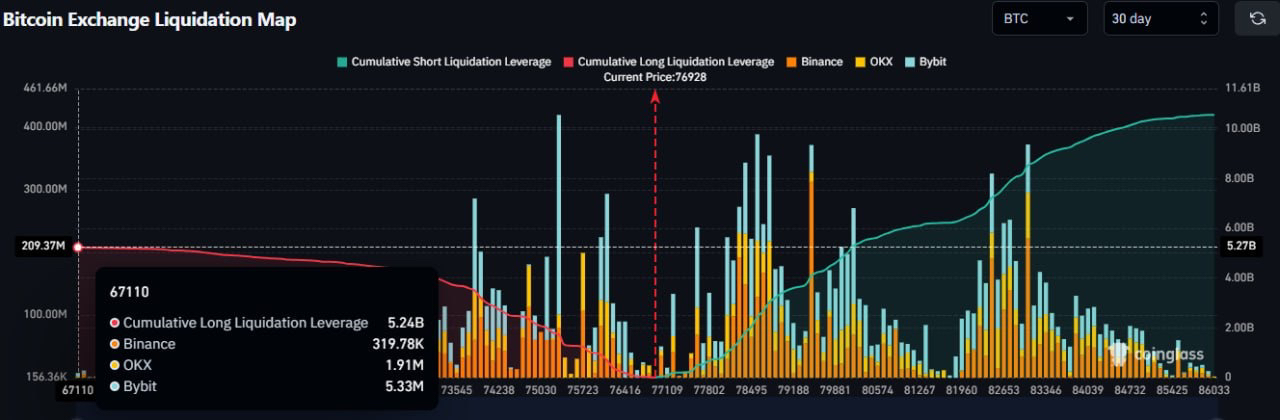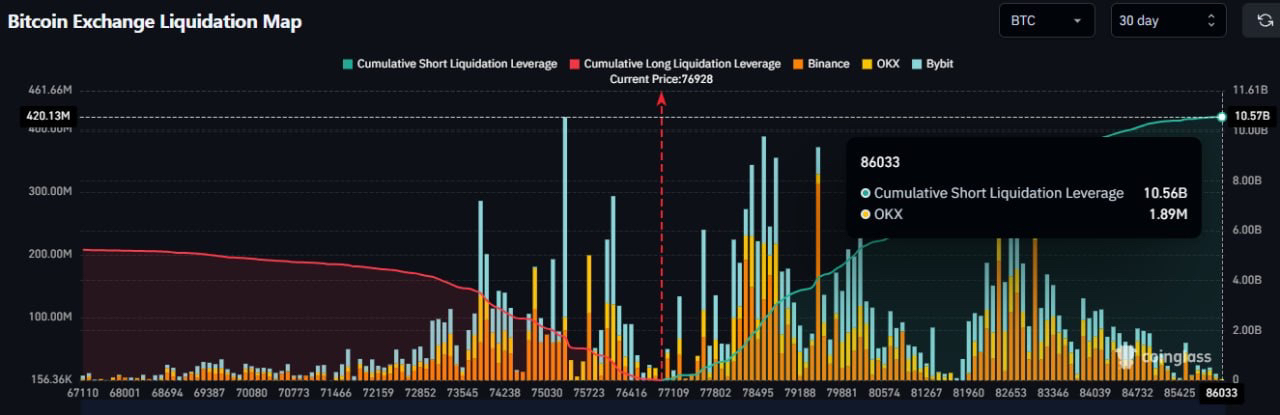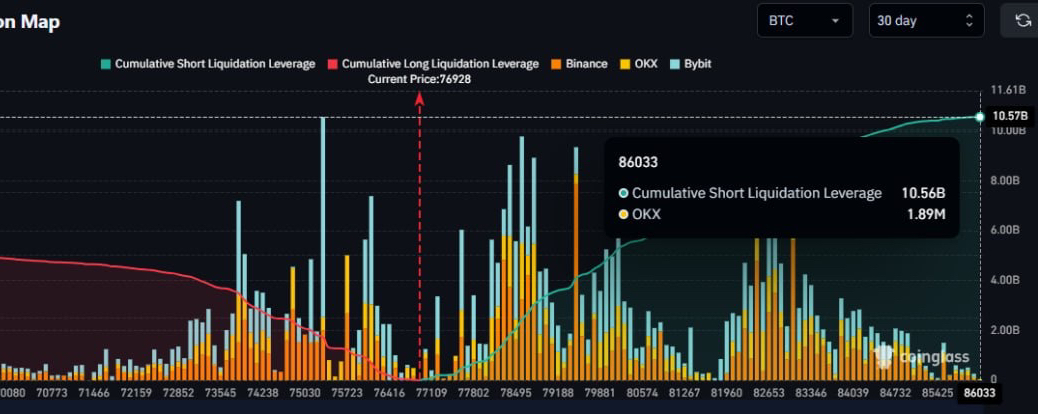

The current liquidation map shows a clear asymmetry in leveraged exposure:
- Significant Long liquidation leverage is clustered below the current price, with a major pool around $67,110 (over $5.2B cumulative).
- Substantial Short liquidation leverage has built up above the market, particularly near $86,033 (over $10.5B cumulative).
This setup creates two strong liquidity magnets on opposite sides of the current price (~$76,928). A decisive move in either direction could trigger a strong cascading effect due to the concentrated leverage.
Such imbalances often lead to increased volatility as the market hunts these liquidity pockets.