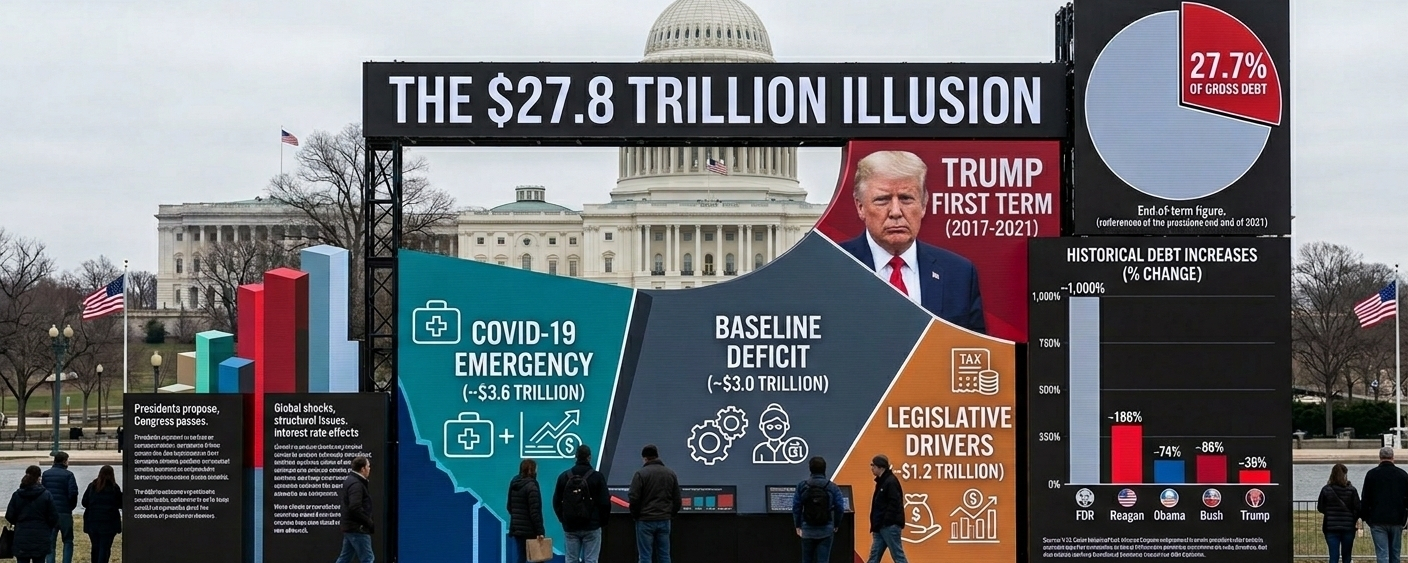
The internet loves a clean statistic, and right now, a massive one is making the rounds: “Donald Trump is single-handedly responsible for 27.7% of the total U.S. national debt.” It’s an eye-catching headline, but as with most things in macroeconomics, the raw math tells one story, while the structural reality tells another. If you look at the ledger, the national debt sat at $19.95 trillion when Trump took office in 2017 and climbed to $27.75 trillion by January 2021—meaning the total debt at the end of that term equaled roughly 27.7% of the total accumulated pile. $TON
But did one administration drive that spike single-handedly? Not exactly. When you peel back the layers, the debt explosion is a mix of global shocks, compounding interest, and bipartisan spending. $ZEREBRO
📊 The Trillion-Dollar Breakdown
To understand how the U.S. added roughly $7.8 trillion in just four years, you have to look at where the capital actually went:
The COVID-19 Emergency (~$3.6 Trillion): The single largest catalyst wasn’t a partisan policy, but a global pandemic. Bipartisan rescue packages like the CARES Act injected trillions into the economy to prevent a total financial meltdown. $TRUTH
The Baseline Deficit (~$3.0 Trillion): Long before 2017, the Congressional Budget Office (CBO) had already locked in trillions in unavoidable spending. Driven by an aging population, mandatory programs like Social Security and Medicare—alongside interest on past debt—ensured the ledger would grow regardless of who was in the White House.
Legislative Drivers (~$1.2 Trillion): This includes discretionary spending hikes passed by Congress and the 2017 Tax Cuts and Jobs Act, which stimulated growth but reduced federal revenue inflows.
🏛️ Dollars vs. Percentages: The Historical Context
Is it the biggest increase in American history? That depends entirely on your yardstick:
By Raw Dollars: Yes, modern administrations will almost always break records because the economy is larger than ever. For context, Barack Obama’s two terms added roughly $8.6 trillion, while Donald Trump’s first term added $7.8 trillion.
By Percentage Growth: If we look at how much a president multiplied existing debt, Trump’s first term saw a 39% increase. Historically, that is eclipsed by George W. Bush (~86%), Ronald Reagan (~186%), and Franklin D. Roosevelt (~1,000% via the New Deal and WWII).
🔍 The Bottom Line
Presidents propose budgets, but Congress holds the power of the purse. The nominal 27.7% figure is a striking reminder of how fast America’s fiscal trajectory is accelerating, but blame cannot be assigned to a single individual. The true driver of the national debt is a multi-decade, bipartisan habit of running structural deficits, compounded by the unpredictable reality of global crises.
What aspect of the national debt trajectory should we break down next—the mechanics of how rising interest rates compound the existing balance, or the historical impact of previous debt ceiling standoffs?