
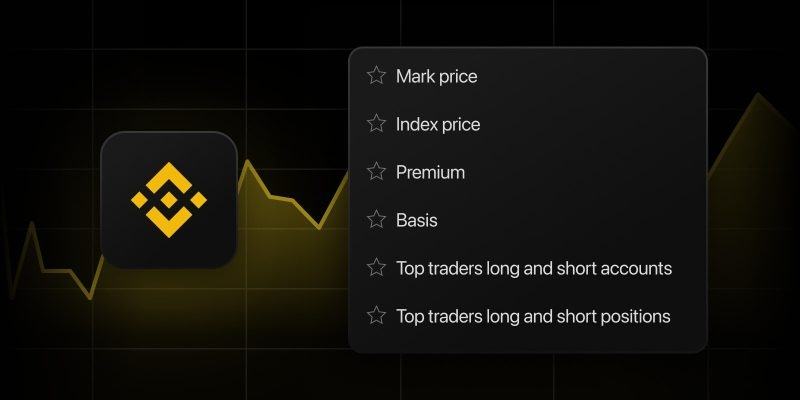



To truly understand where the crypto market is heading, price charts alone aren’t enough — you need the bigger picture. To enhance your research capabilities, we have expanded our indicator suite with a set of Binance derivative metrics for futures and perpetual swaps, ranging from mark price to top traders exposure.
To view the new metrics, open a Binance futures contract or perpetual swap on your Supercharts, navigate to Indicators → Fundamentals → Derivatives, or simply search for the metric by name.
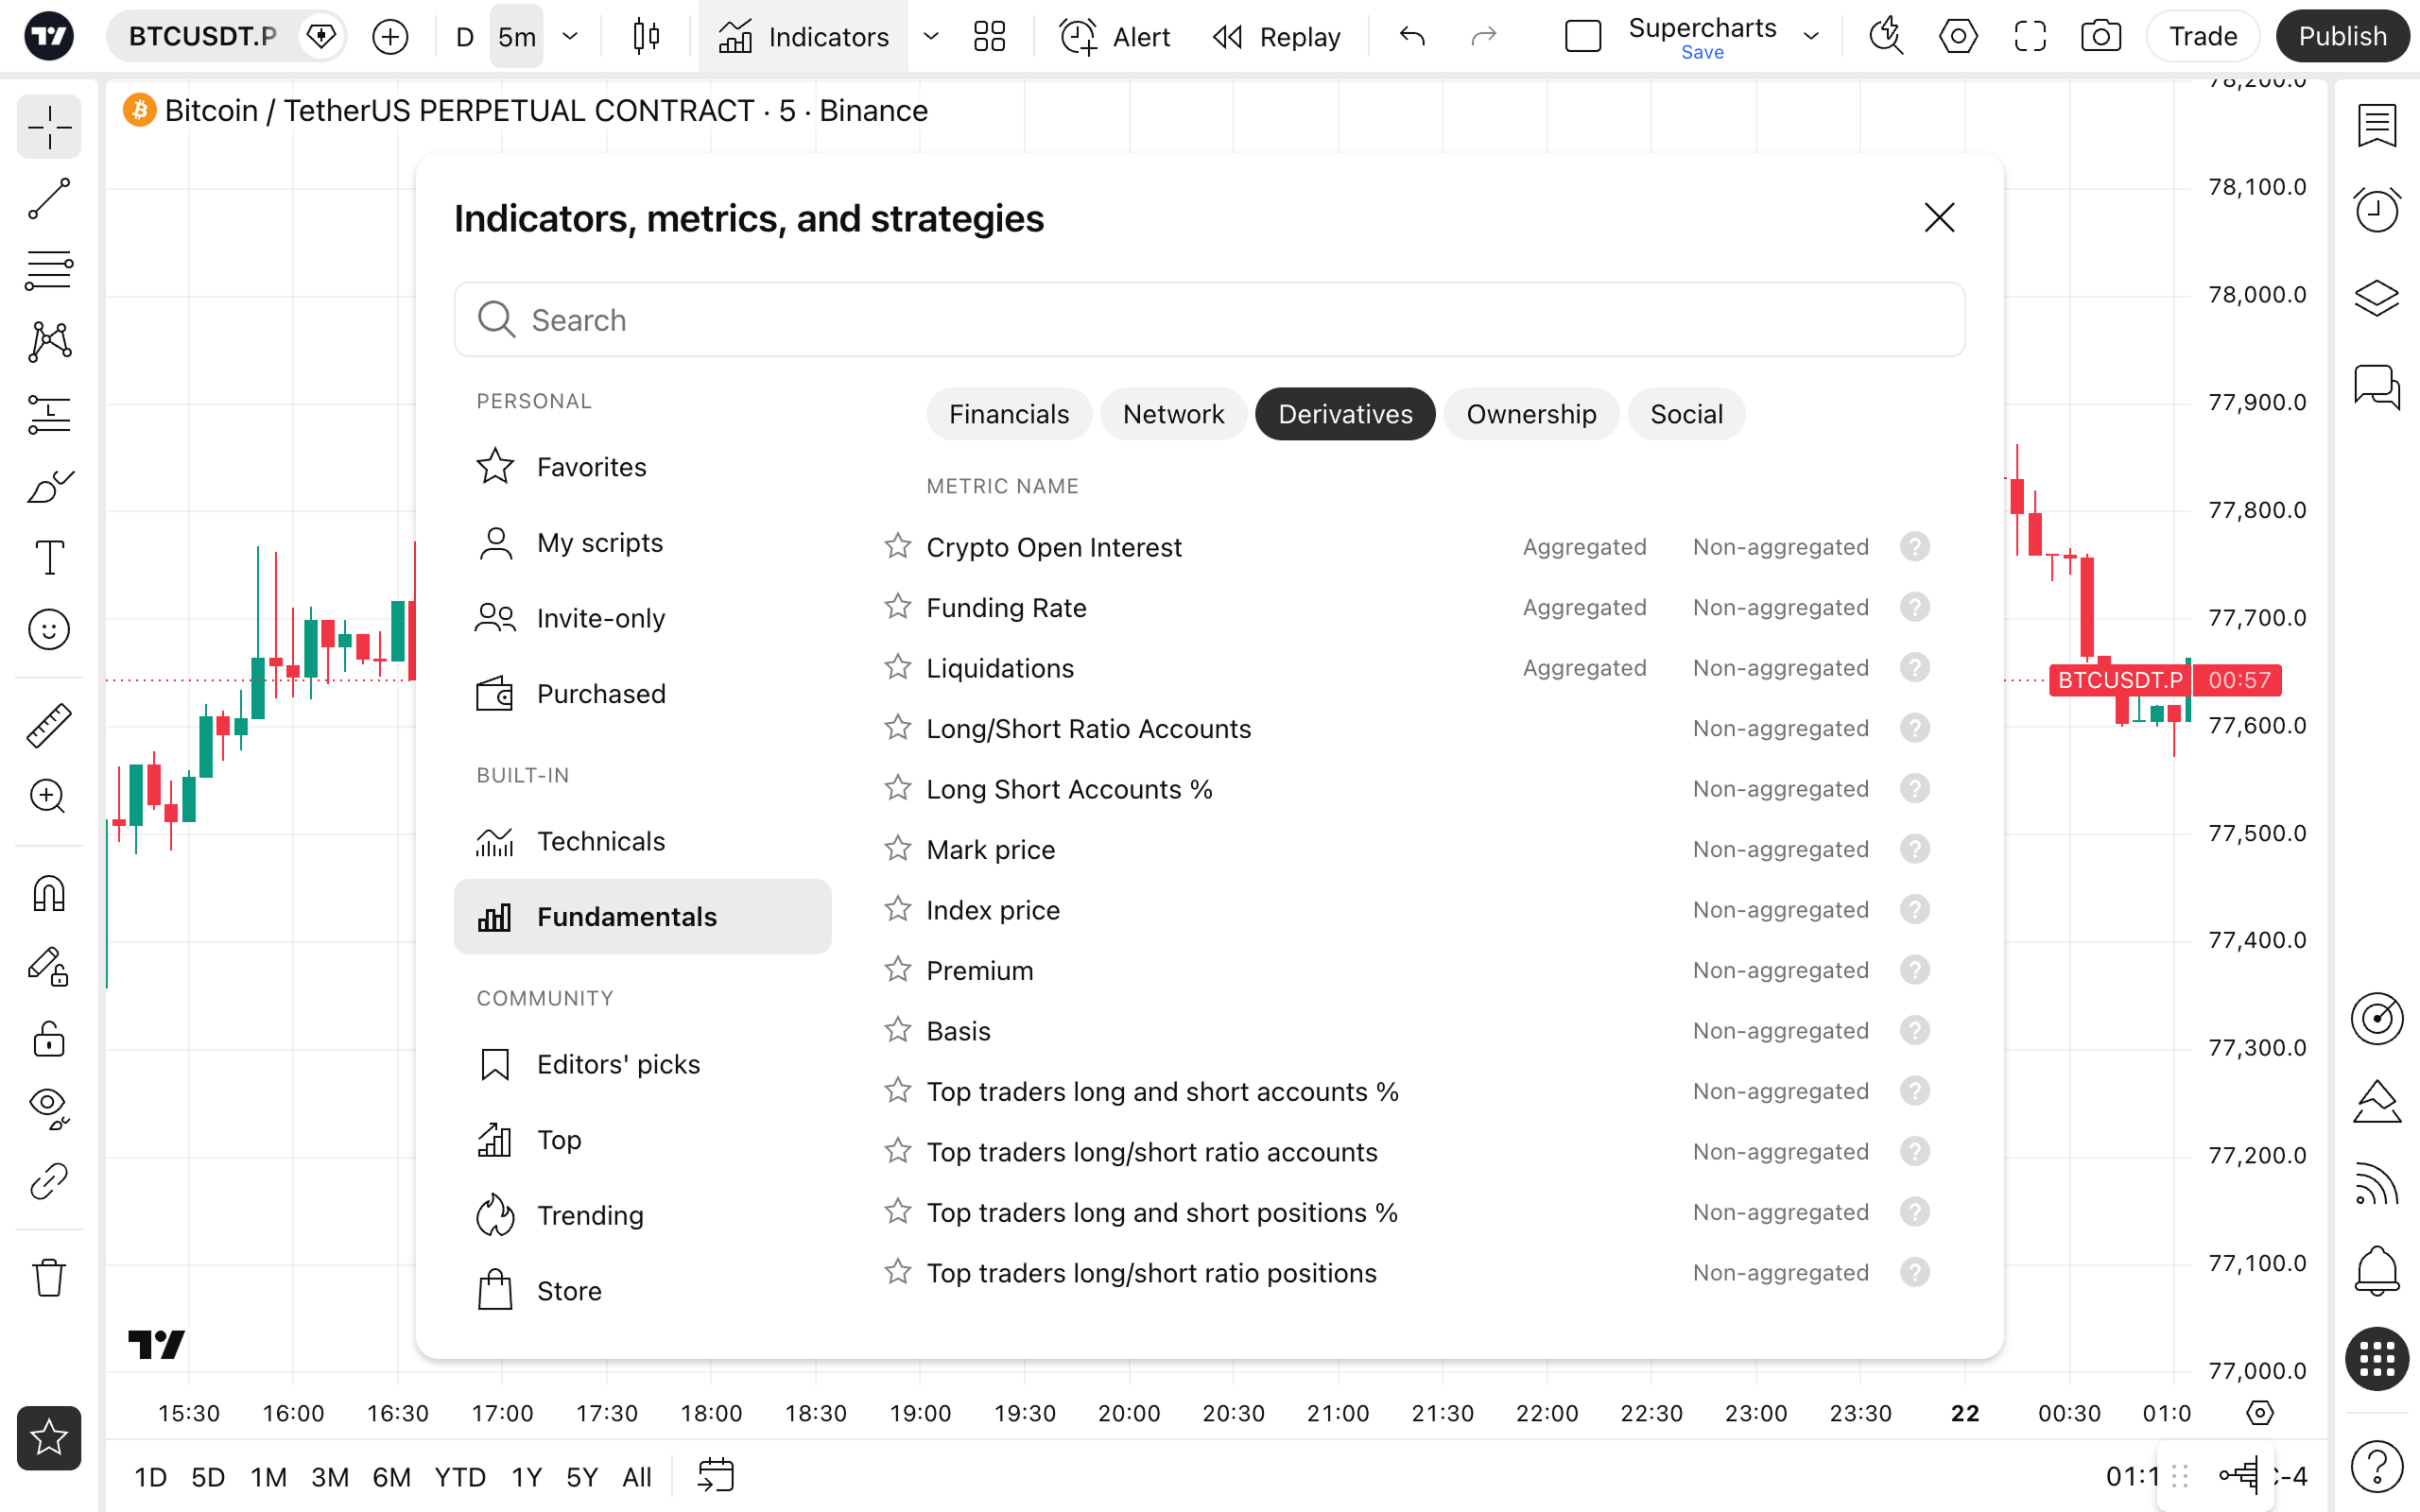
Here is a breakdown of the new indicators and how you can use this data to better understand the crypto markets.
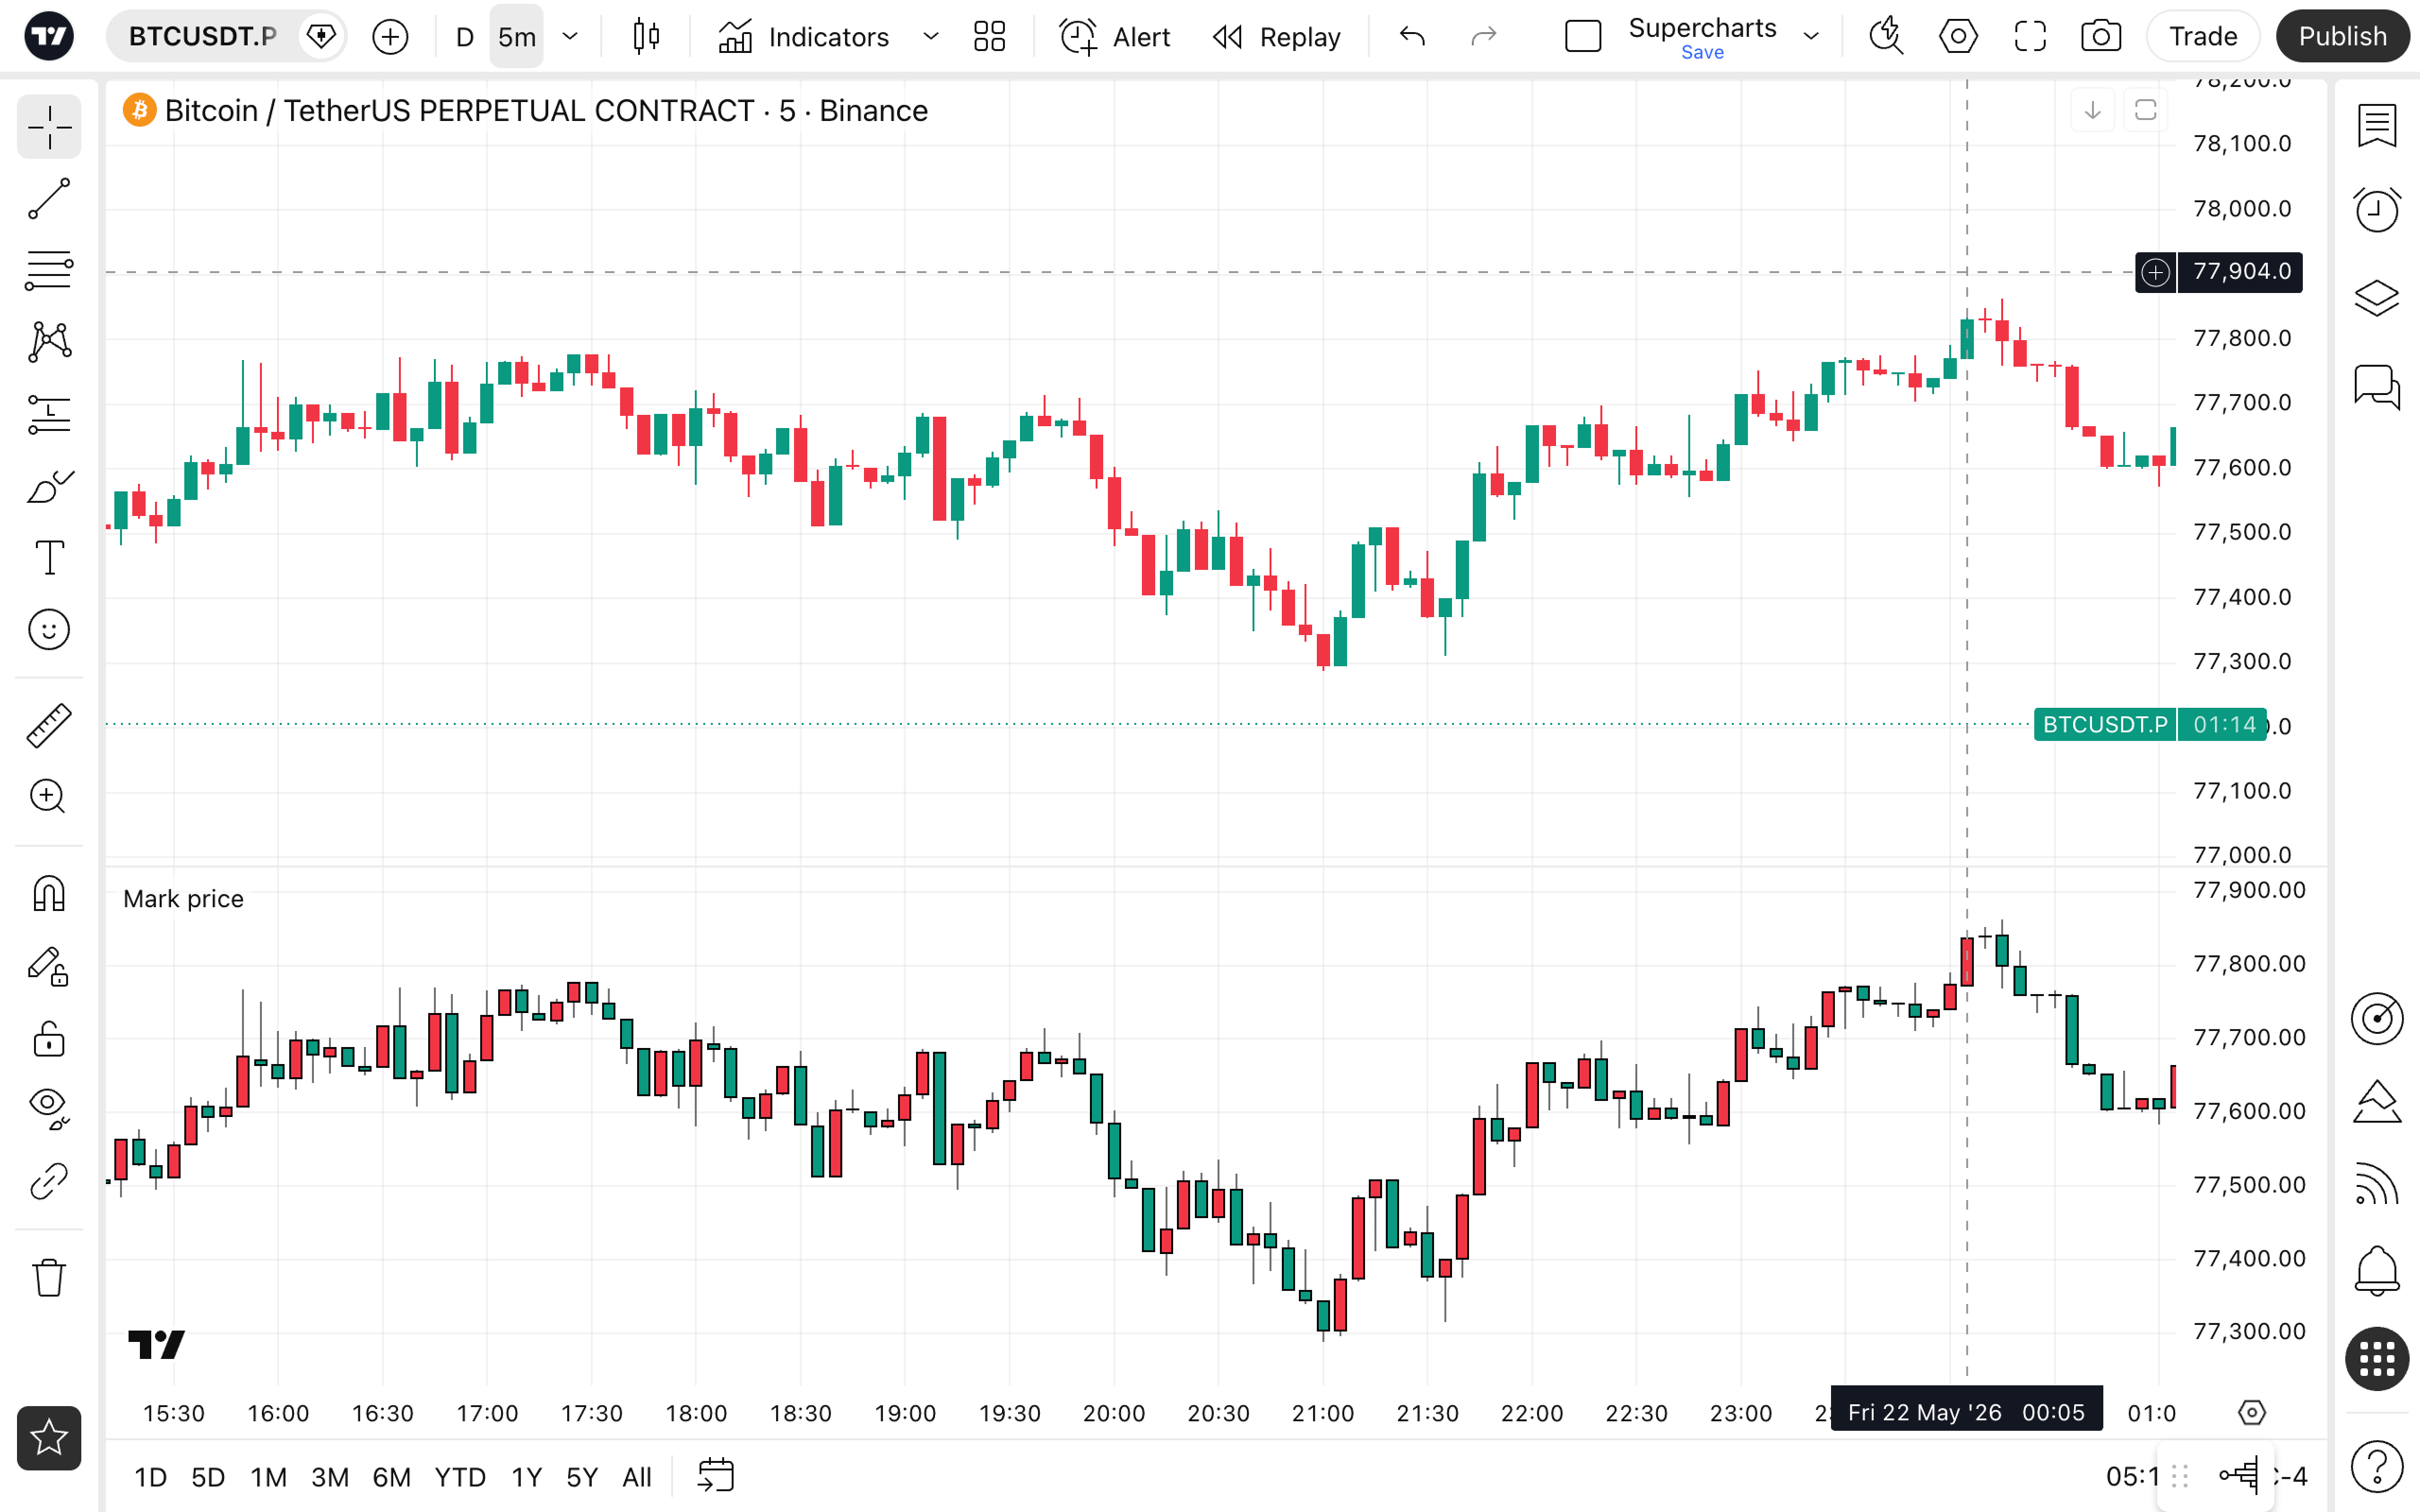
Mark price: identify true value
Mark price is the estimated price an exchange uses for its liquidation and risk management mechanisms. Unlike the last traded price, it smooths out short-term spikes and manipulation, making it highly useful for analysis during periods of extreme market volatility.
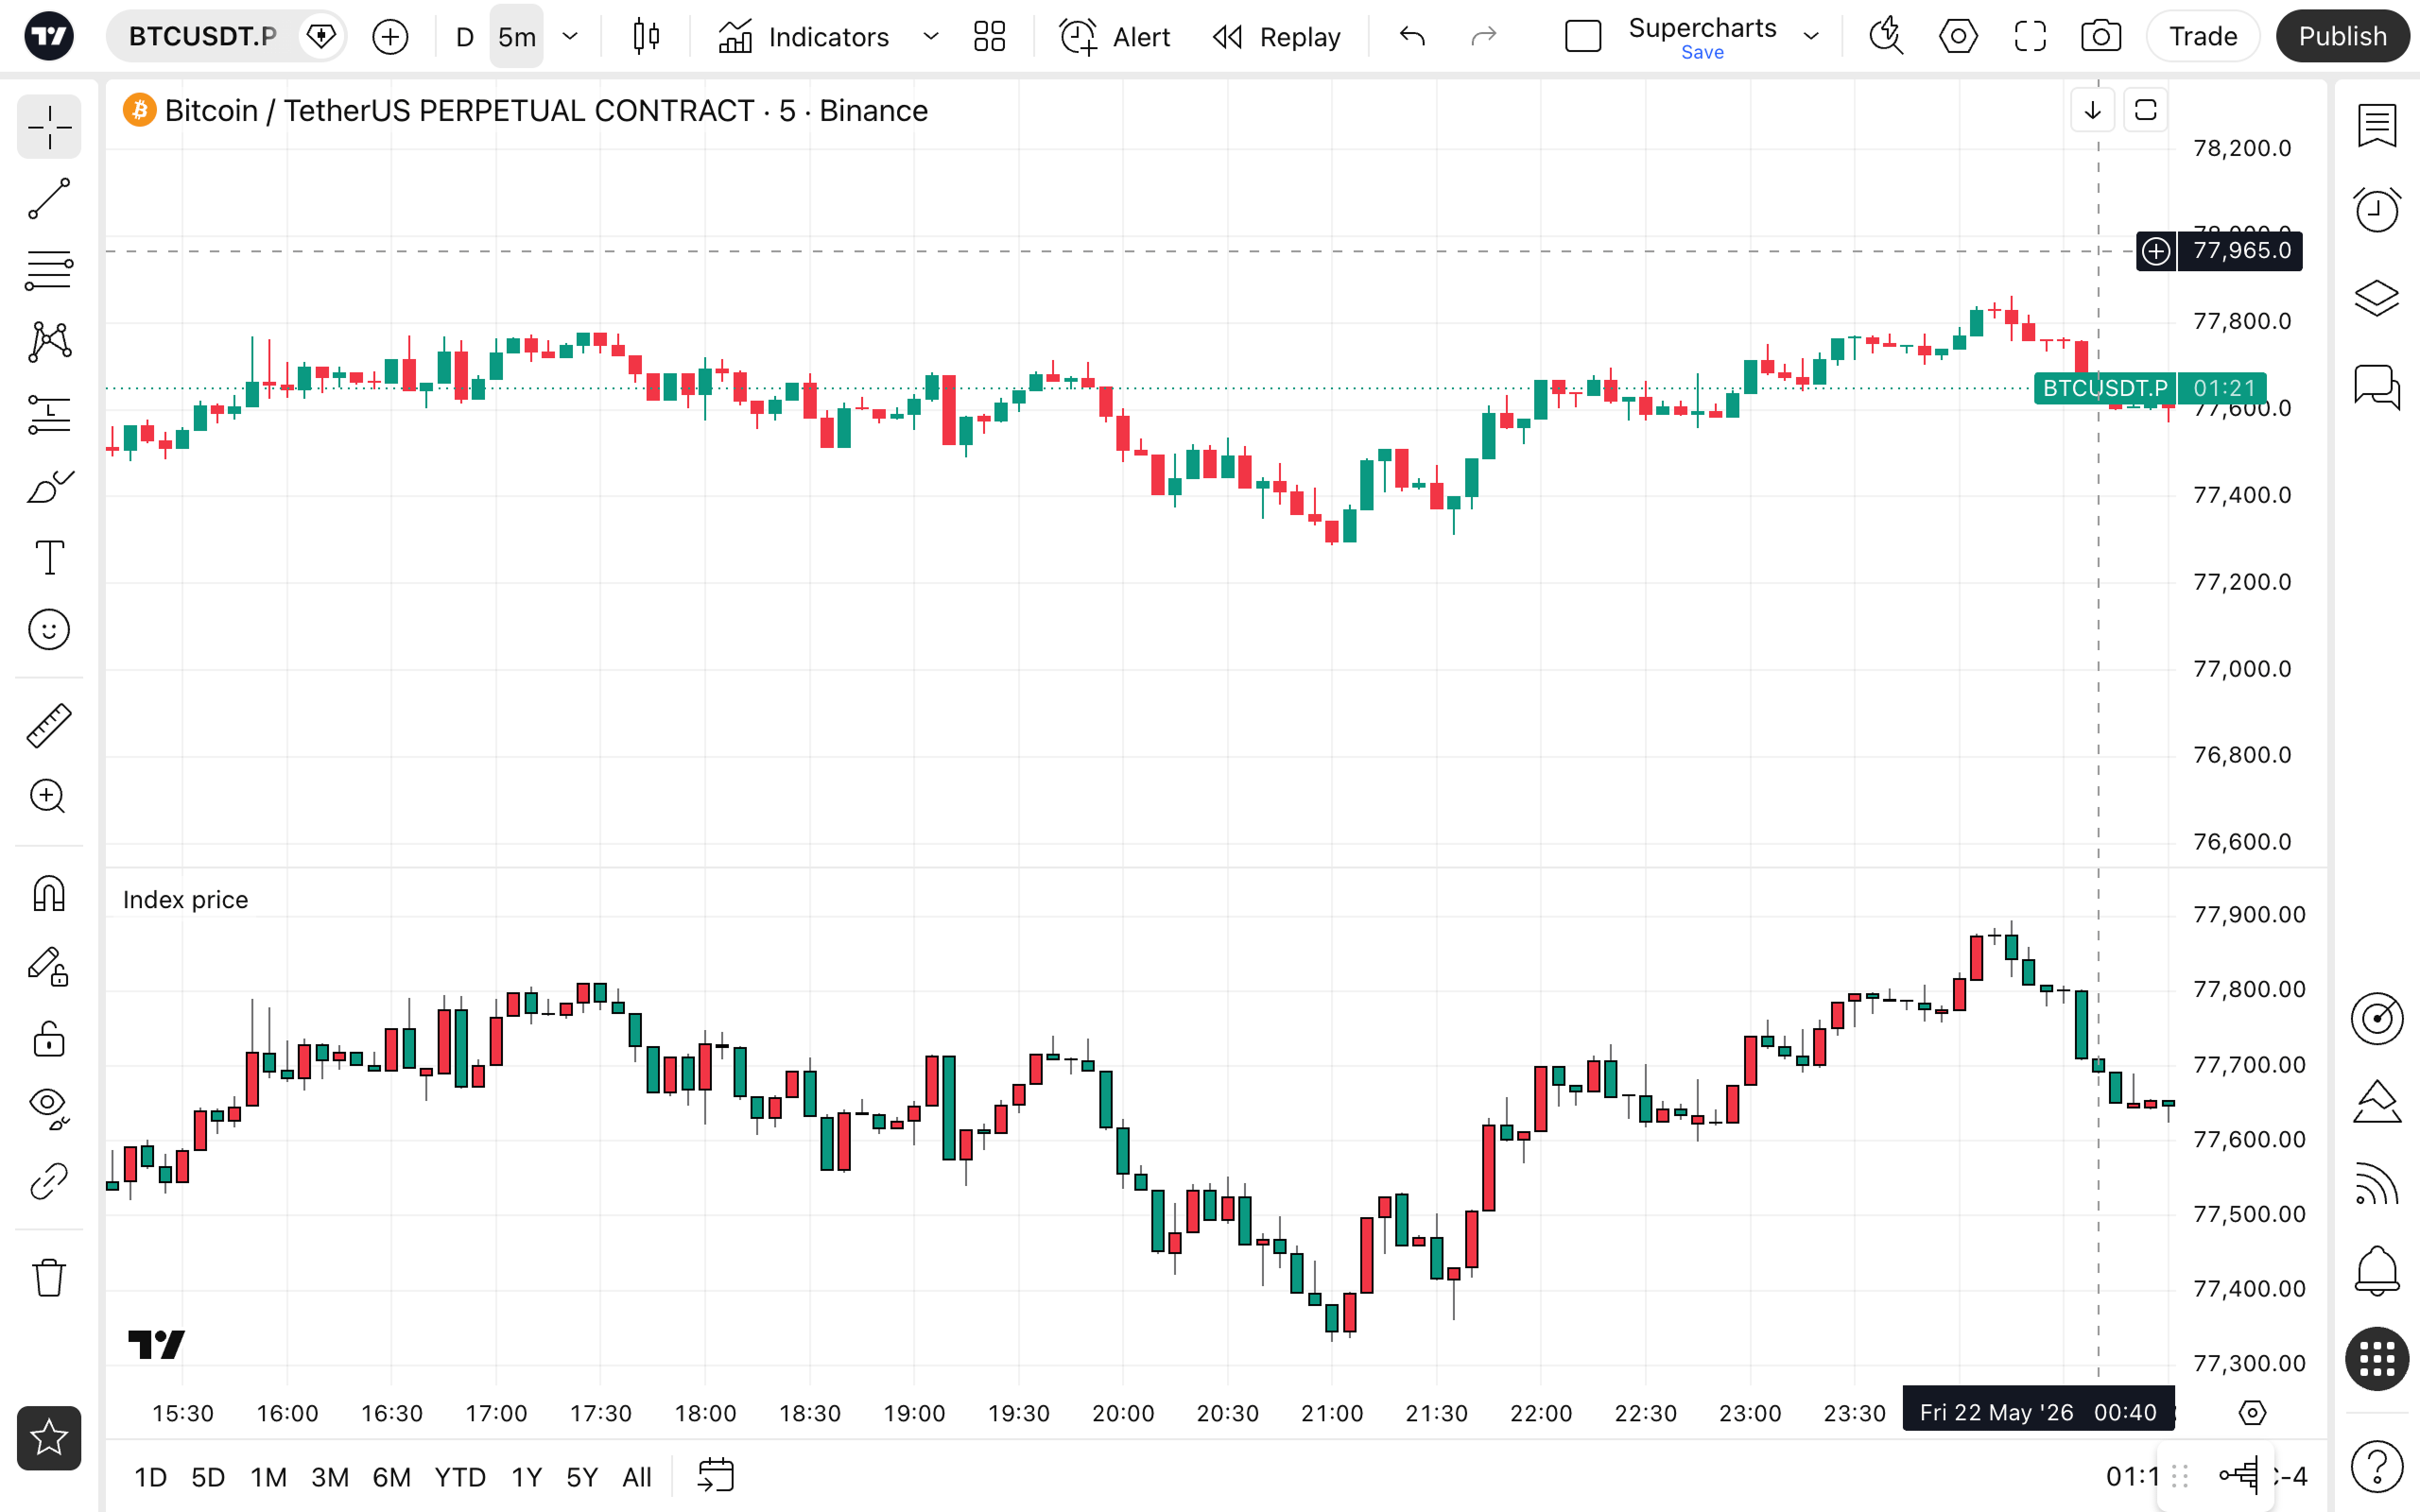
Index price: find the gaps
Index price represents the underlying asset’s price, aggregated across several spot markets. It acts as a benchmark for valuing derivatives, allowing you to compare futures prices with the asset’s real market value to spot discrepancies between the markets.
Premium: navigate the balance
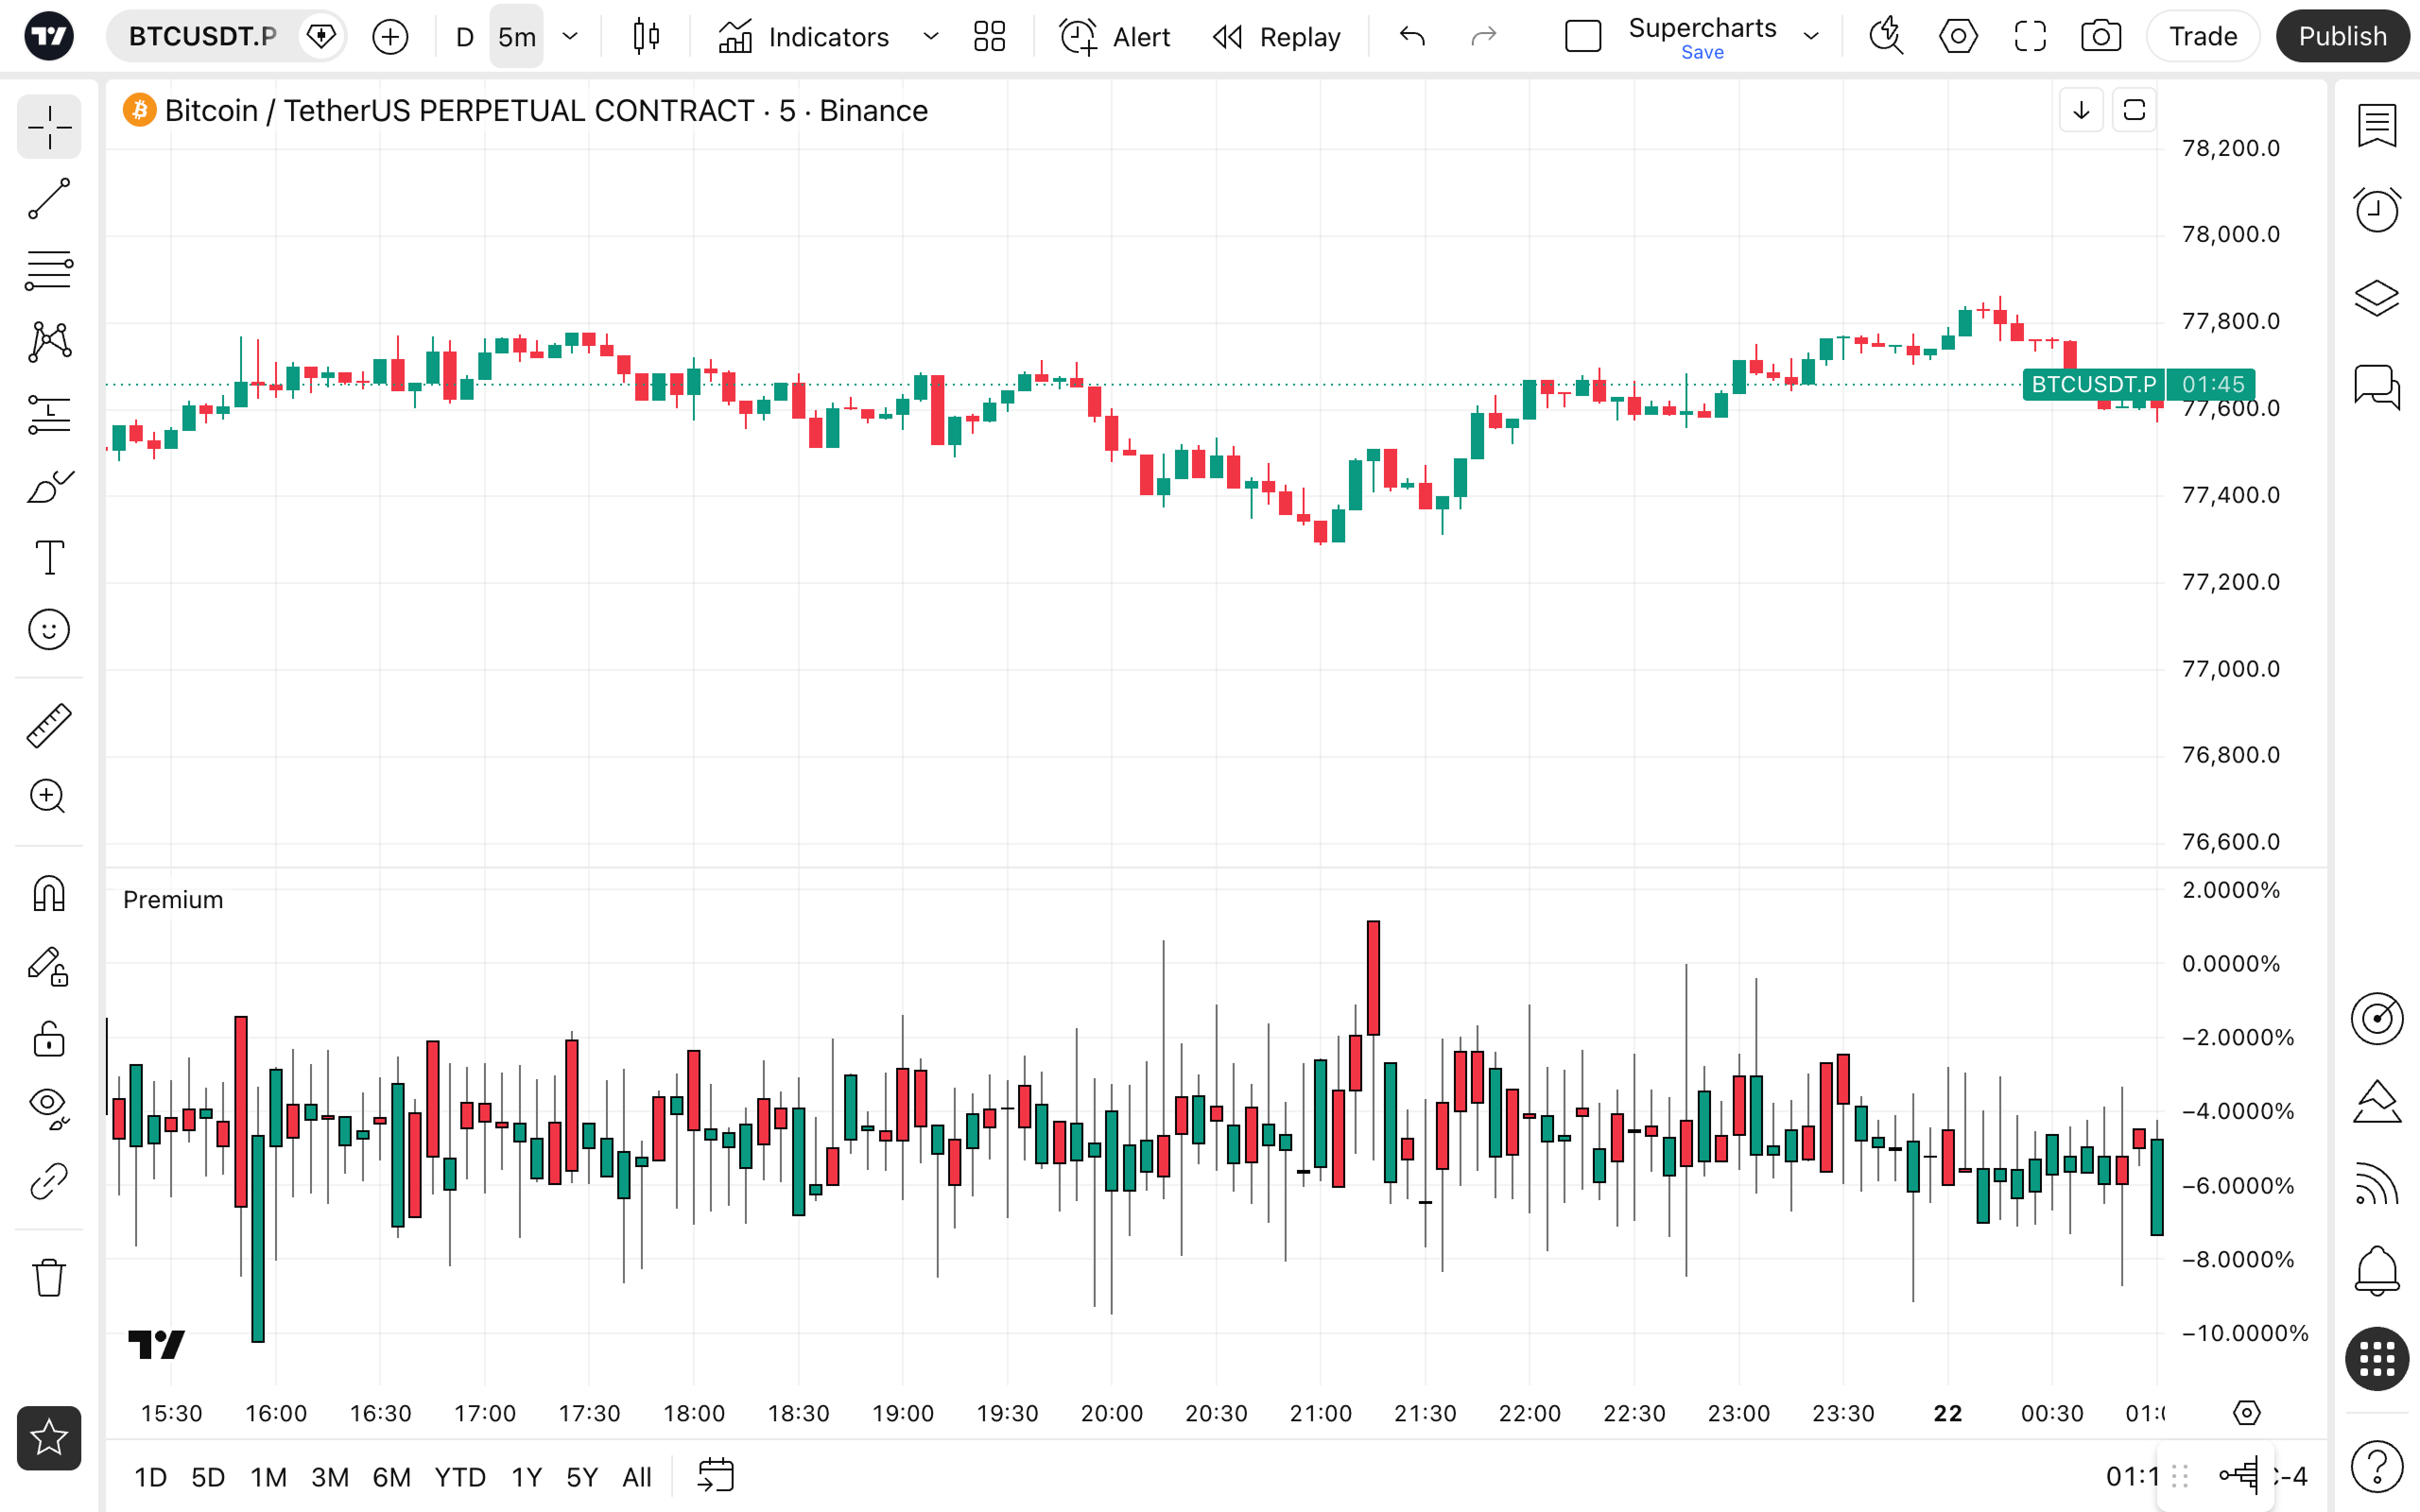
Premium shows the relative spread between the derivative price and the index price. Positive values mean the futures contract is trading above the index price, while negative values mean it is trading below. Analyzing this metric helps gauge overall market sentiment and the balance of supply and demand within the derivatives space.
Basis: assess market structure transitions
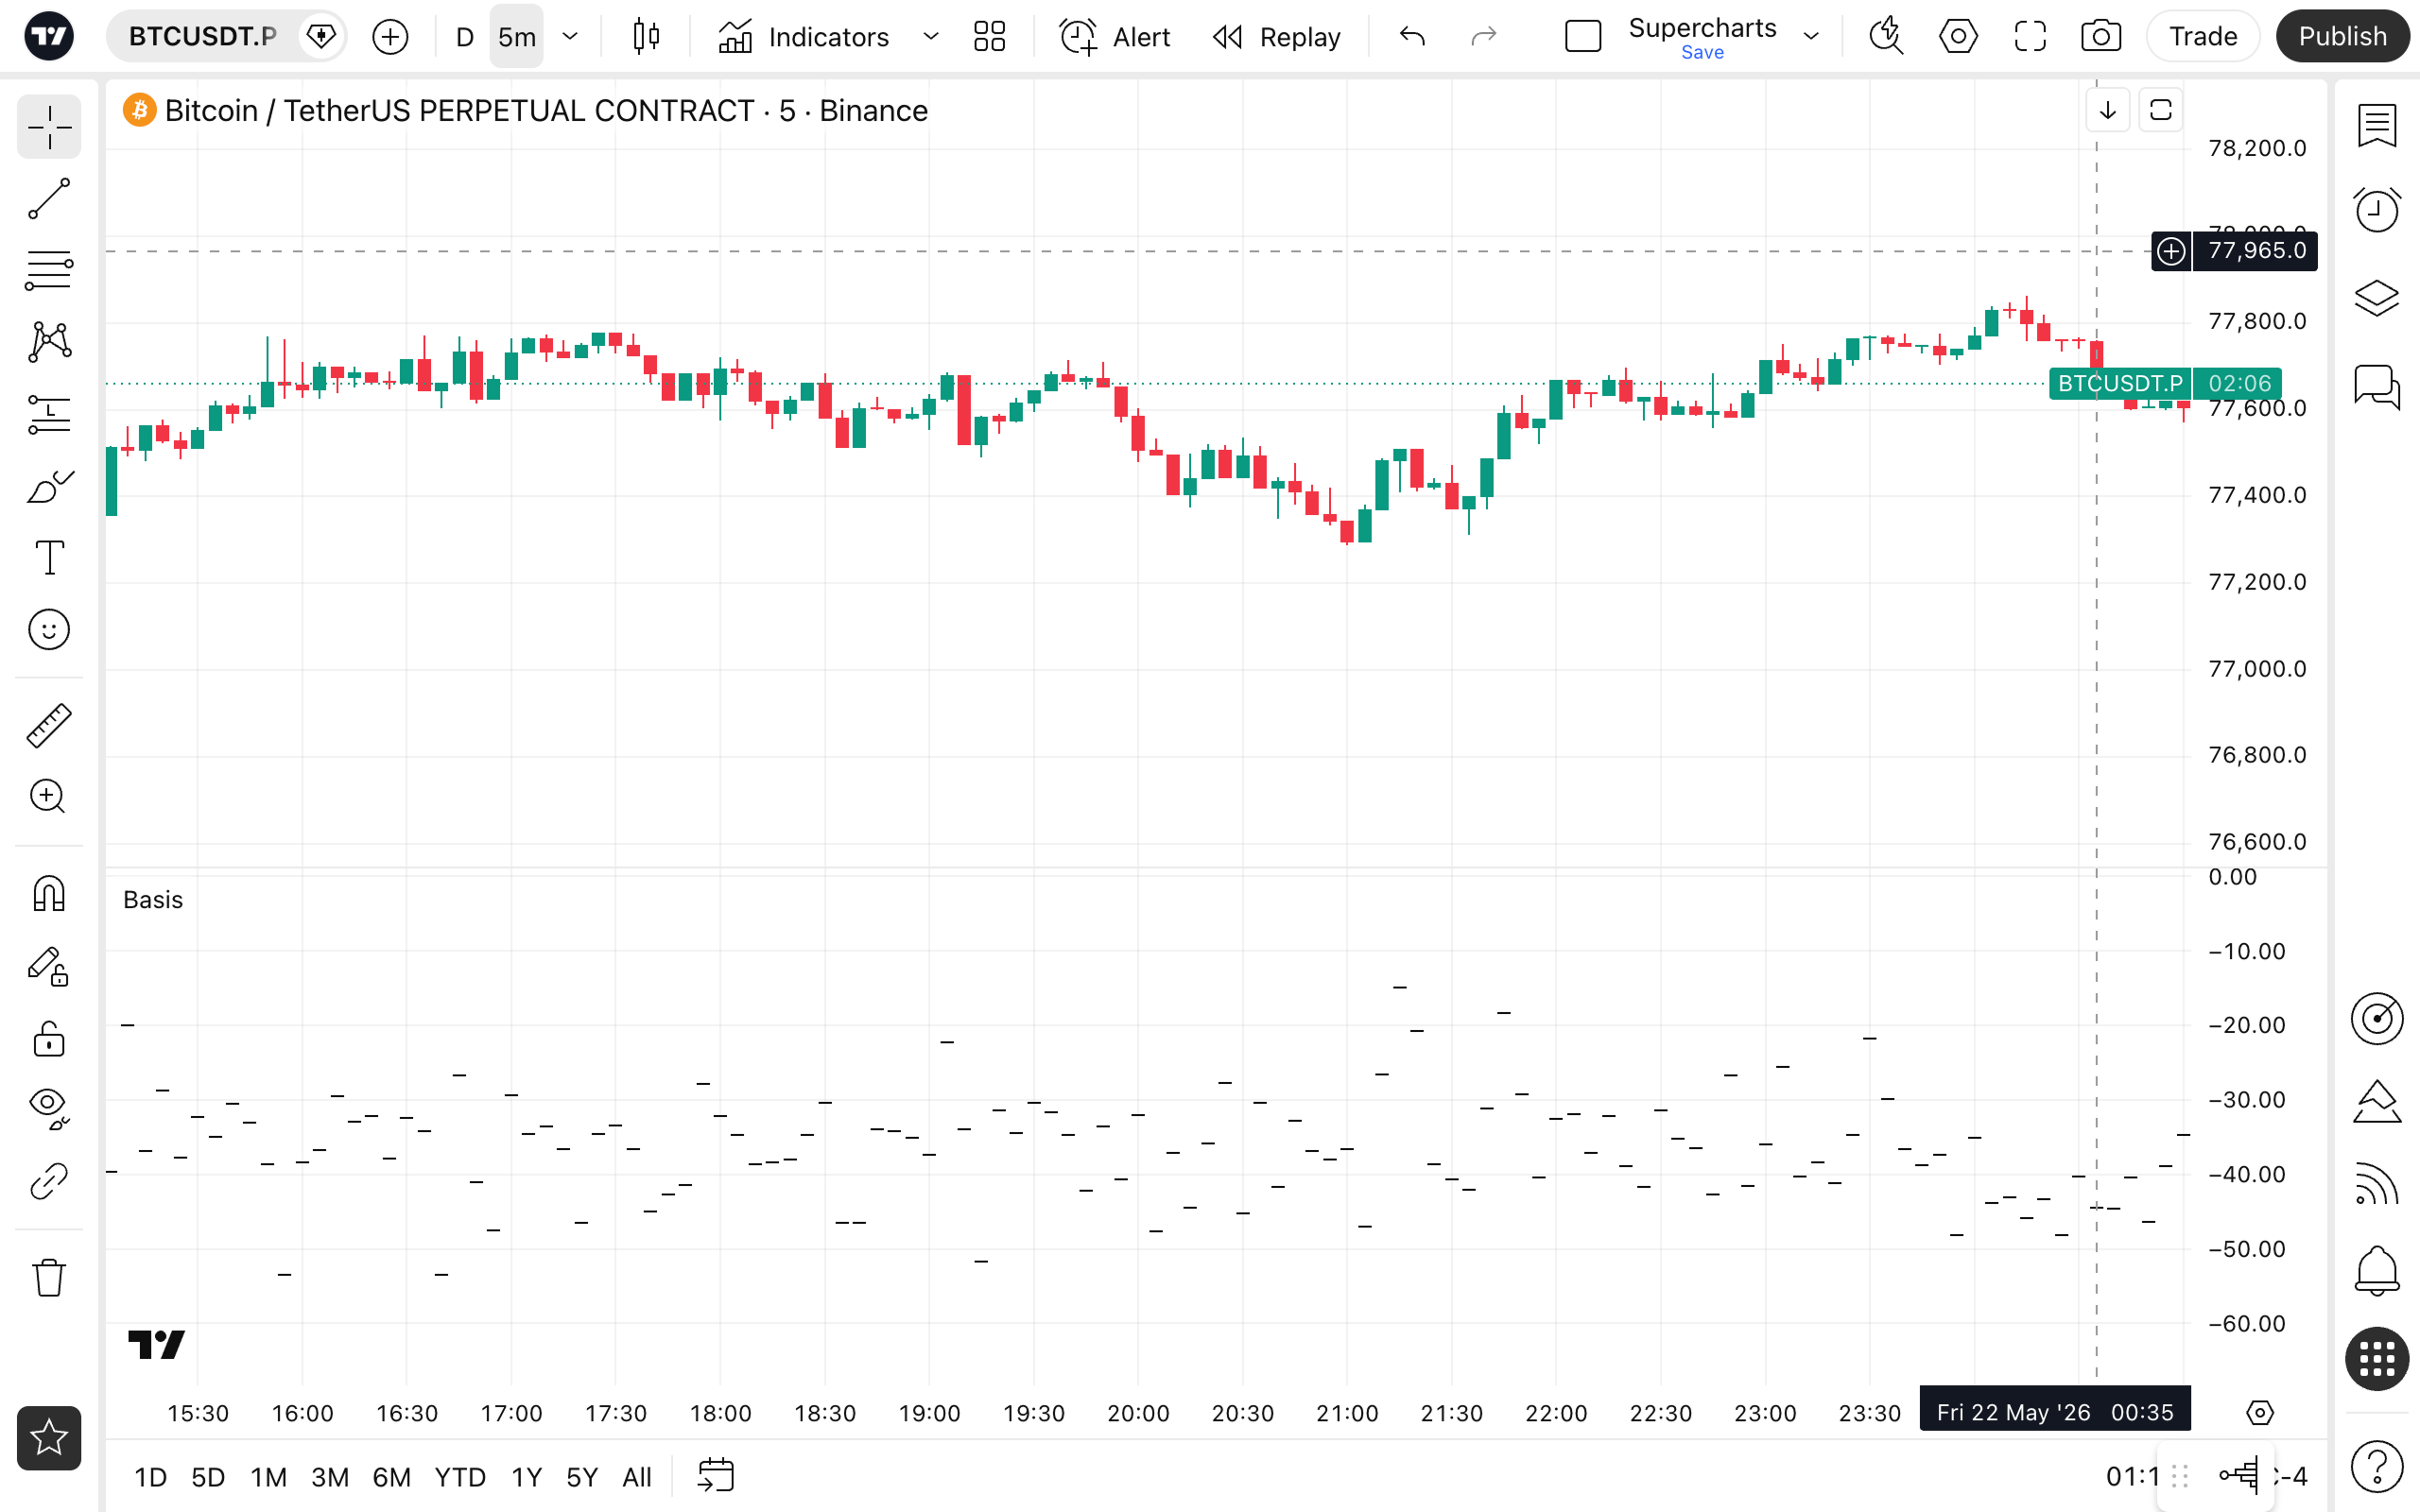
Basis represents the absolute difference between the futures price and the index price. It is used to track shifts between premium and discount environments and to evaluate market structure during volatile phases.
Note: basis is primarily used for dated futures, whereas premium and funding rates are the preferred metrics for perpetuals.
Top traders long and short accounts: map out the bets
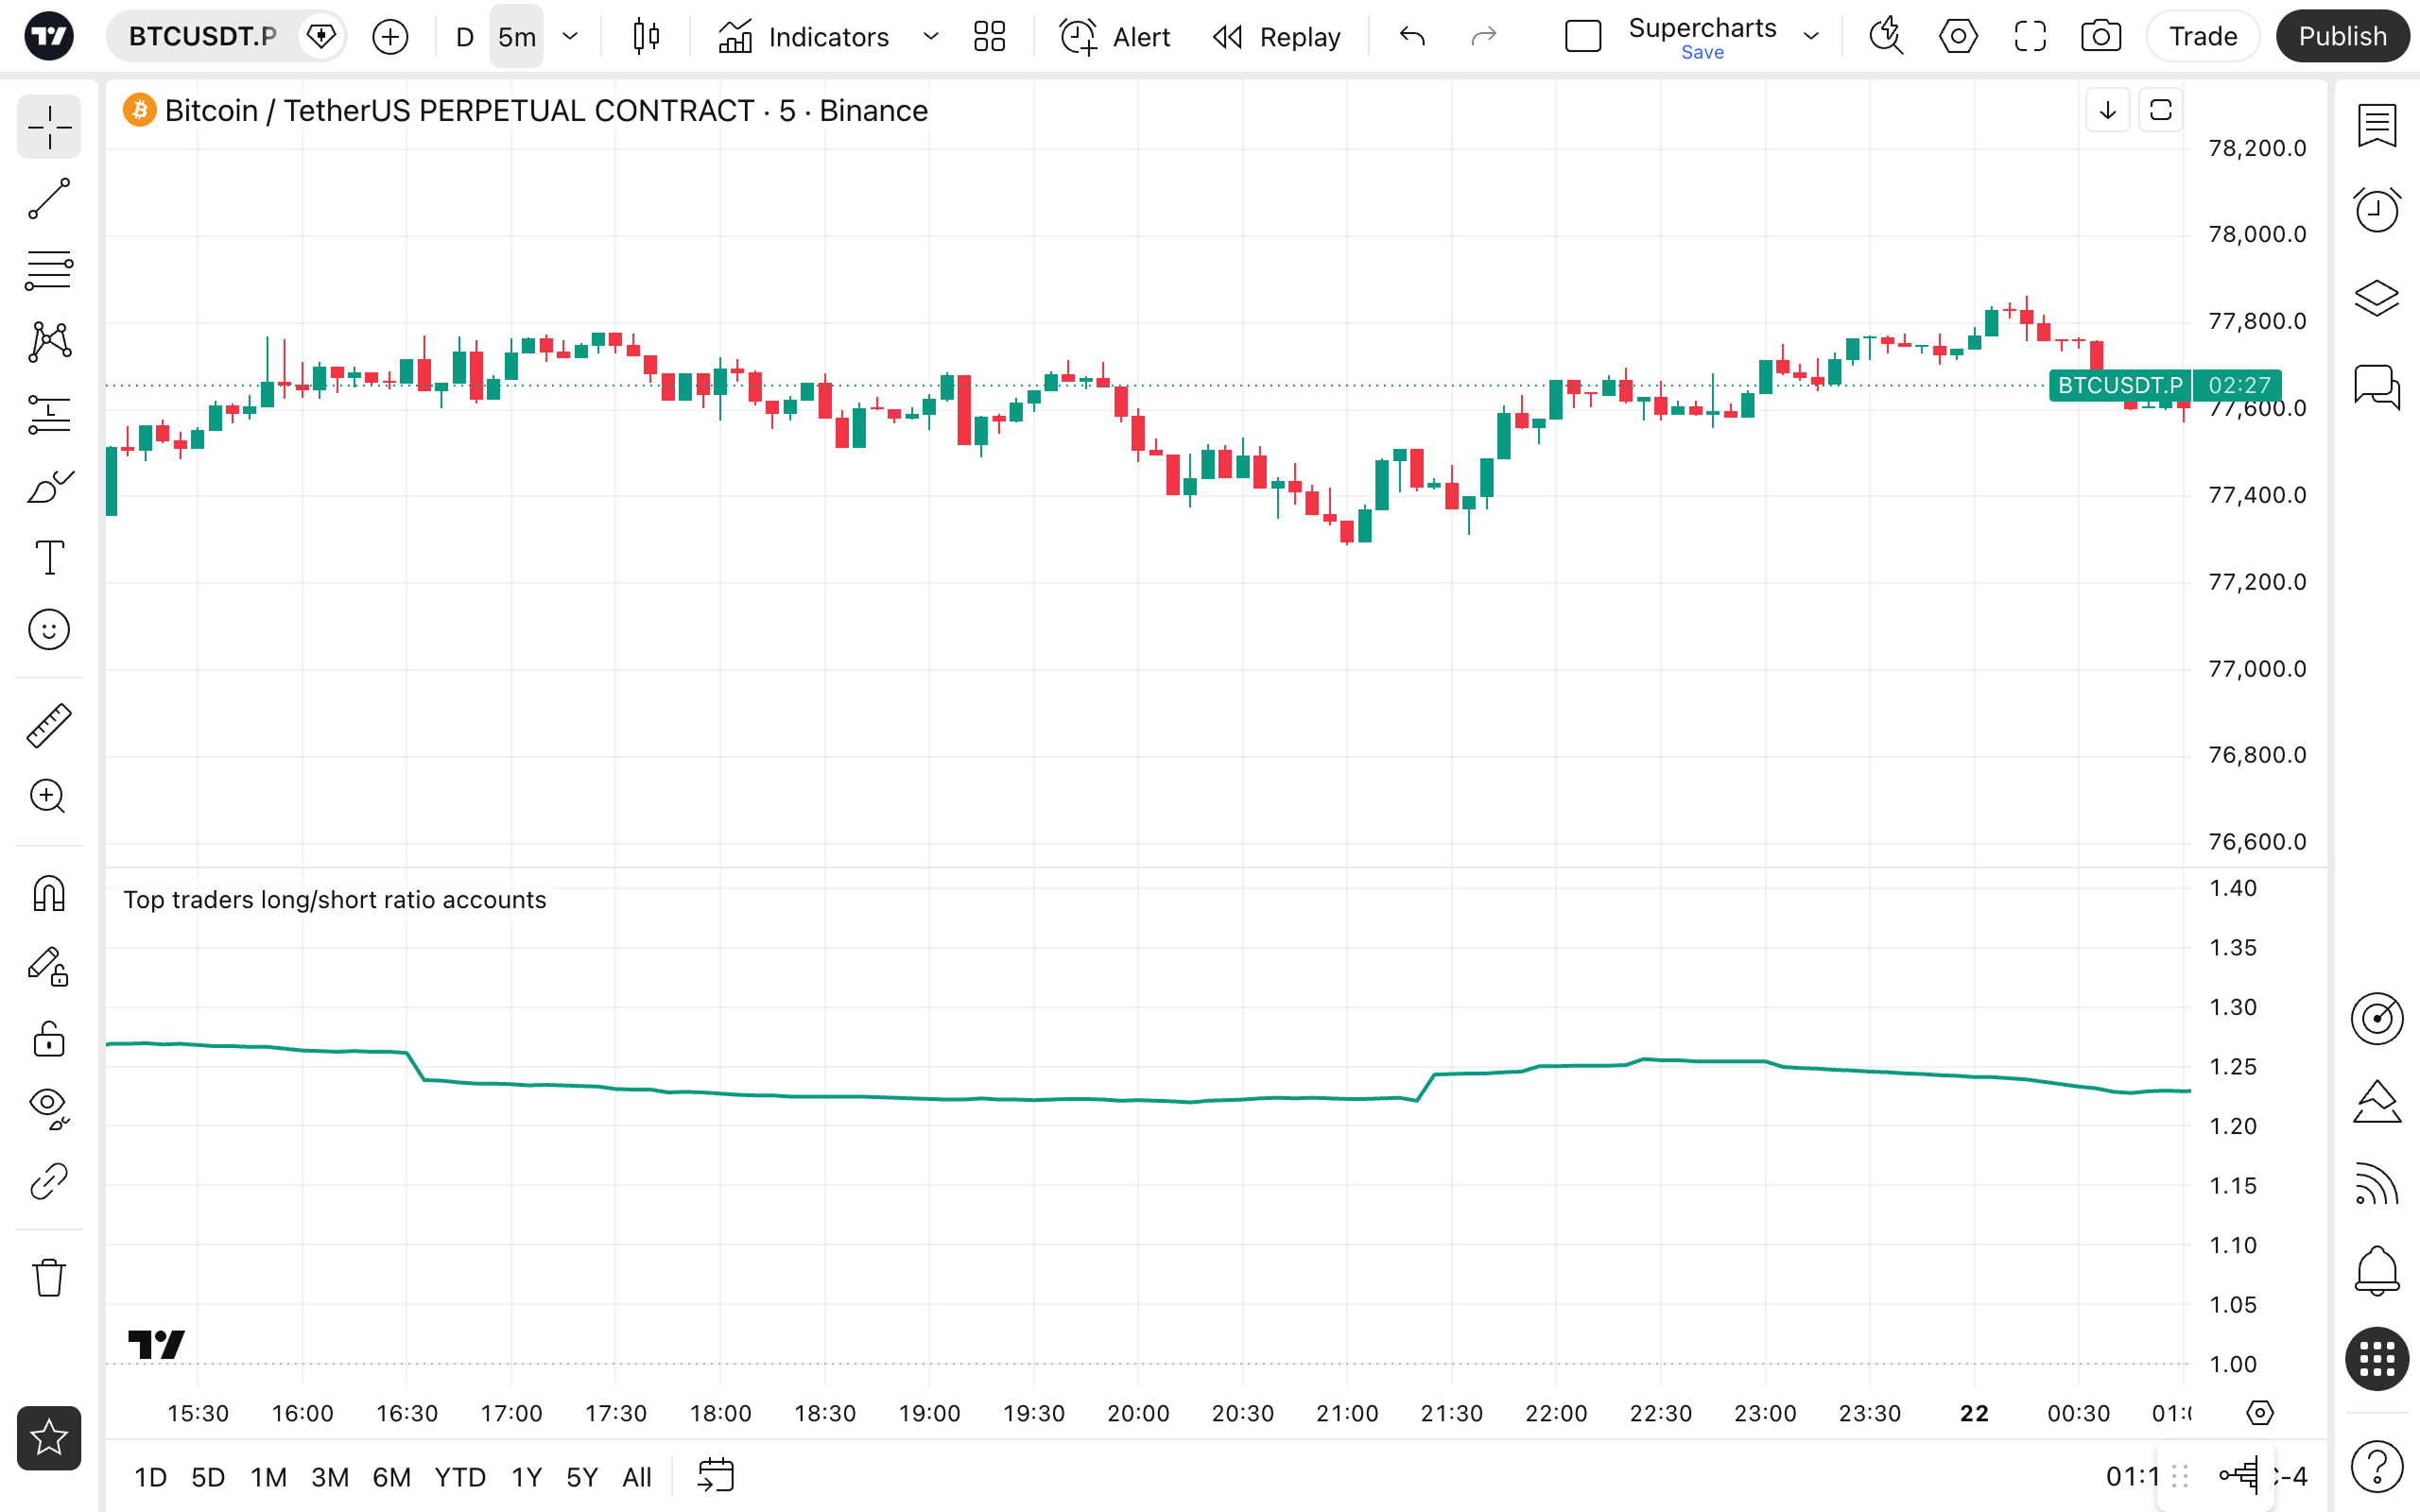
The Top traders long and short accounts % and Top traders long/short ratio accounts metrics show how accounts classified by the exchange as “top traders” are distributed between long and short positions. The account metrics reflect the percentage of top profiles with predominantly long or short exposure, while the ratio metric provides a quick look at which side currently dominates the market. These indicators allow you to gauge the directional sentiment of top market participants and track how it evolves over time.
Top traders long and short positions: follow the volume
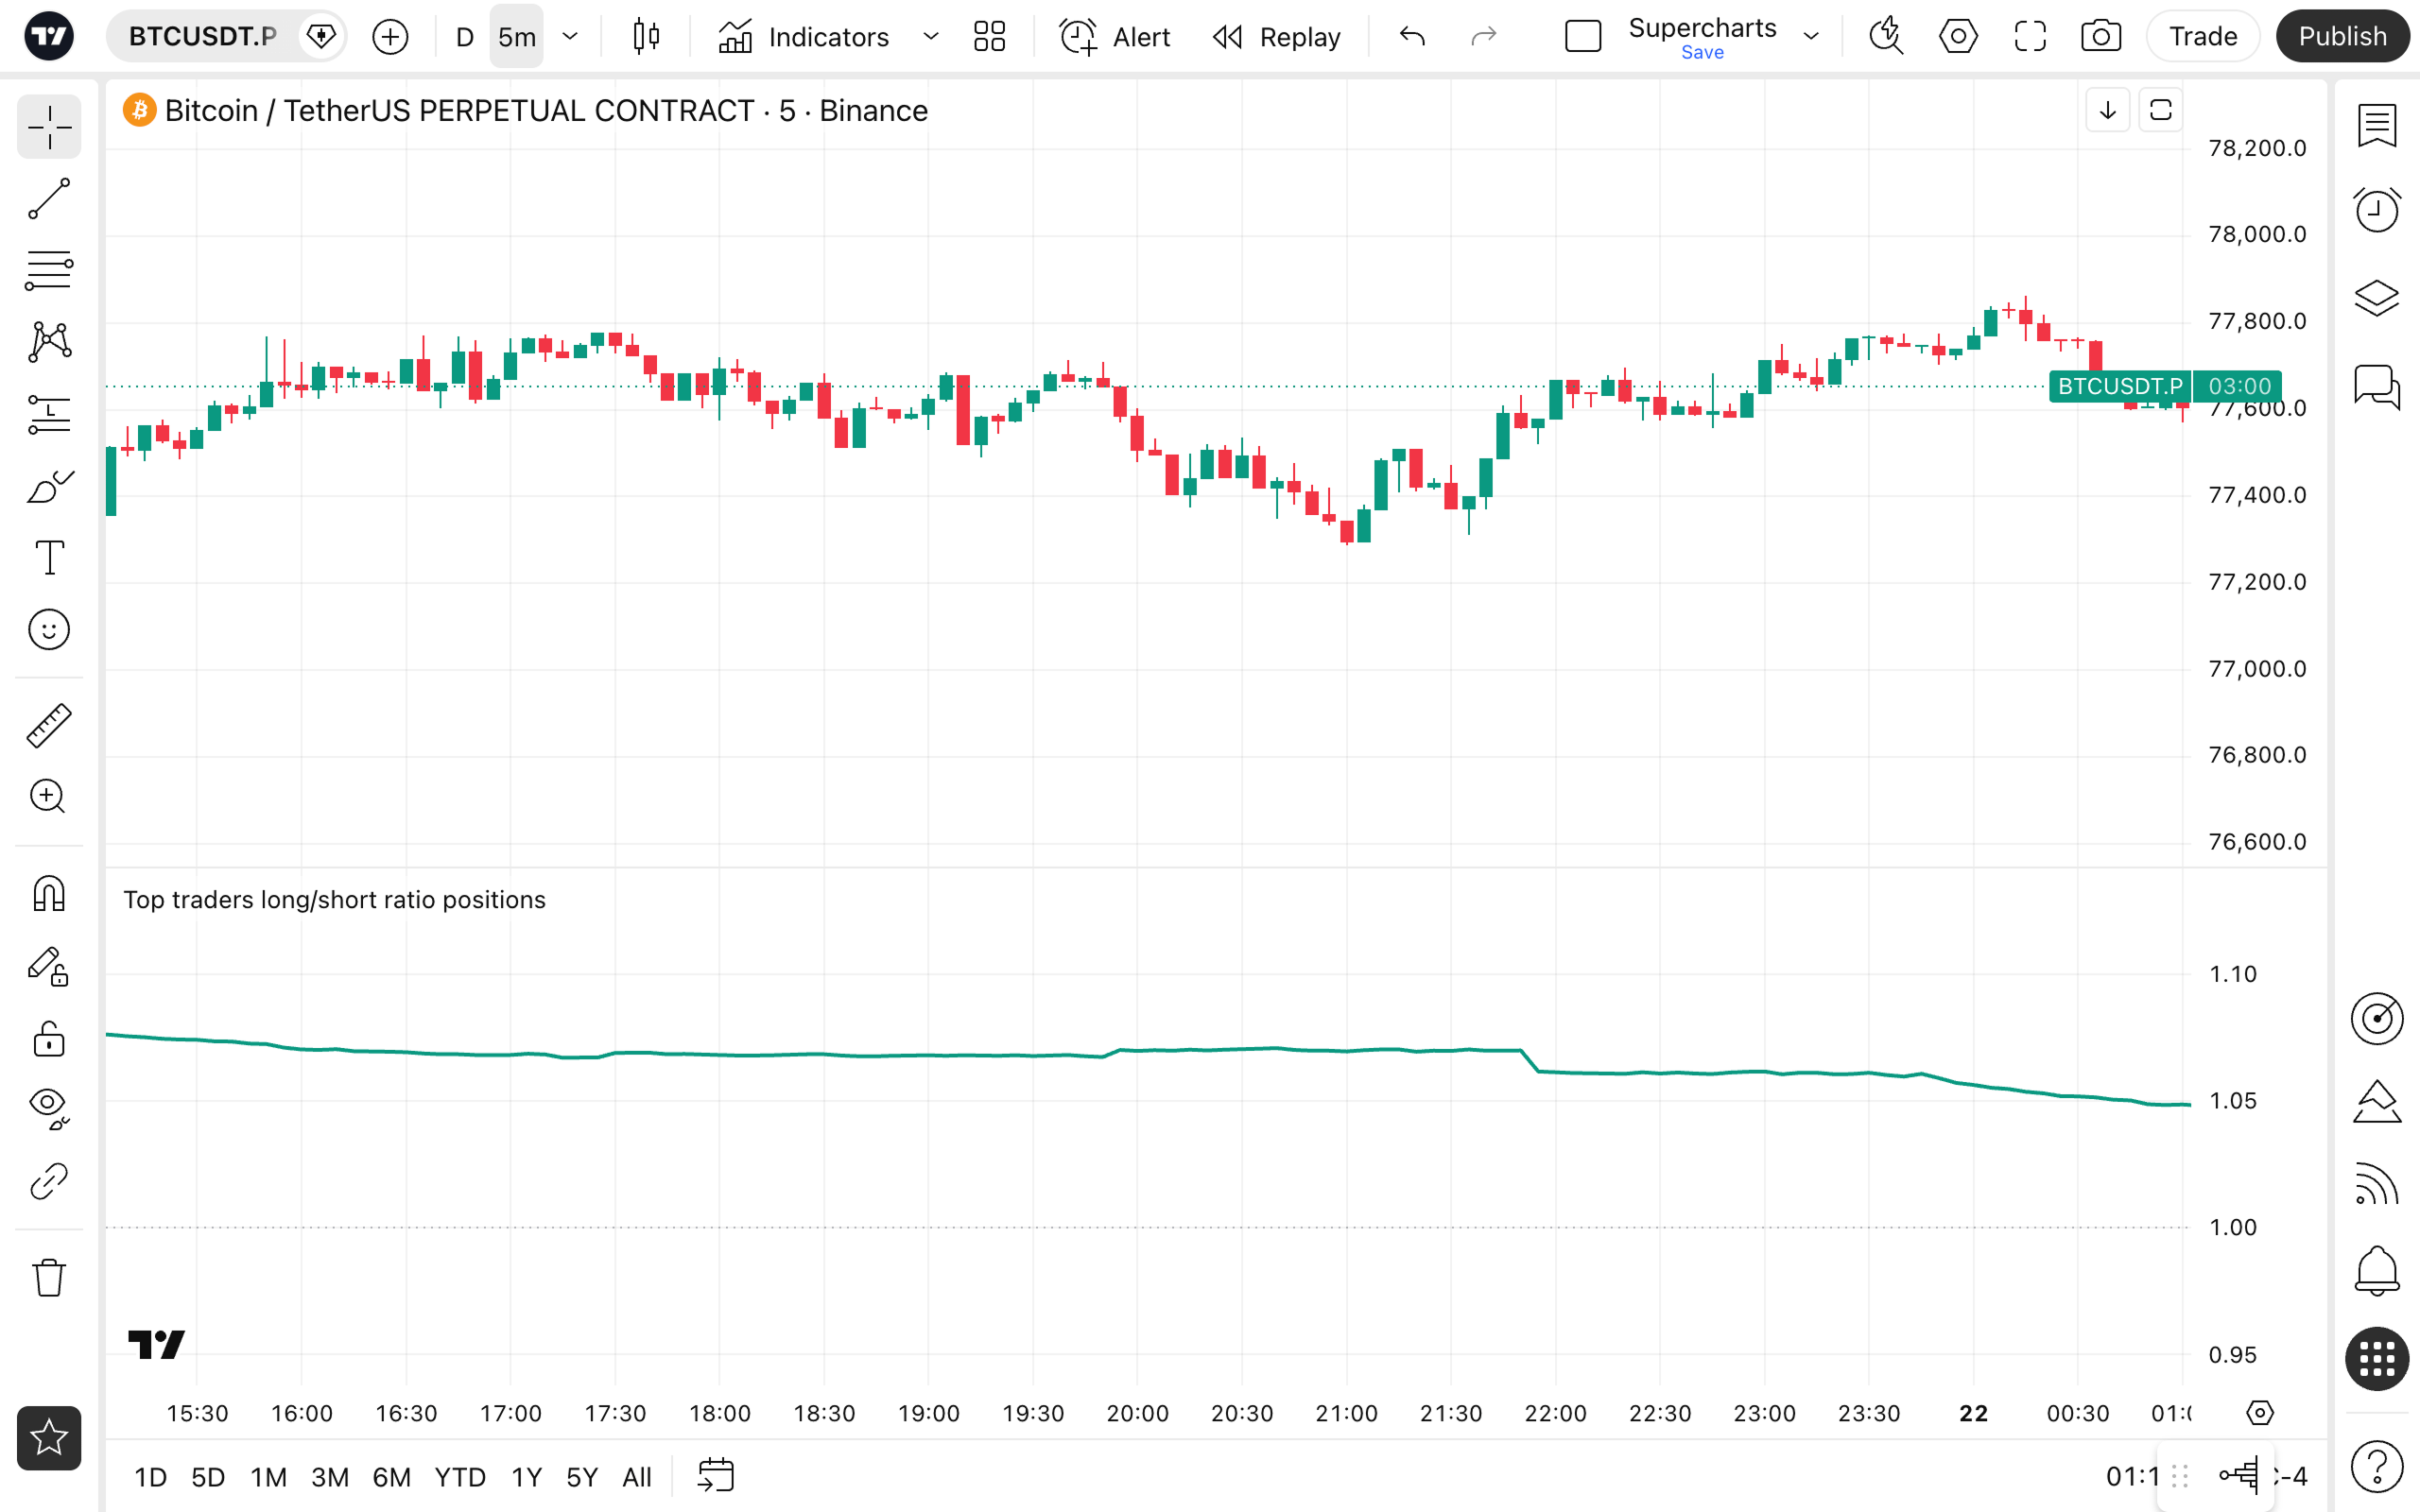
Top traders positions metrics track how the total exposure is split between longs and shorts. Unlike the accounts metrics, which simply count the number of users, positions metrics analyze actual volume. When paired with premium, basis, and price action, these metrics offer a deeper view of market structure and participant behavior.
We hope that this latest addition will help you better navigate the markets and spot shifts before the market moves. Let us know what you think — your feedback helps enhance the platform.