
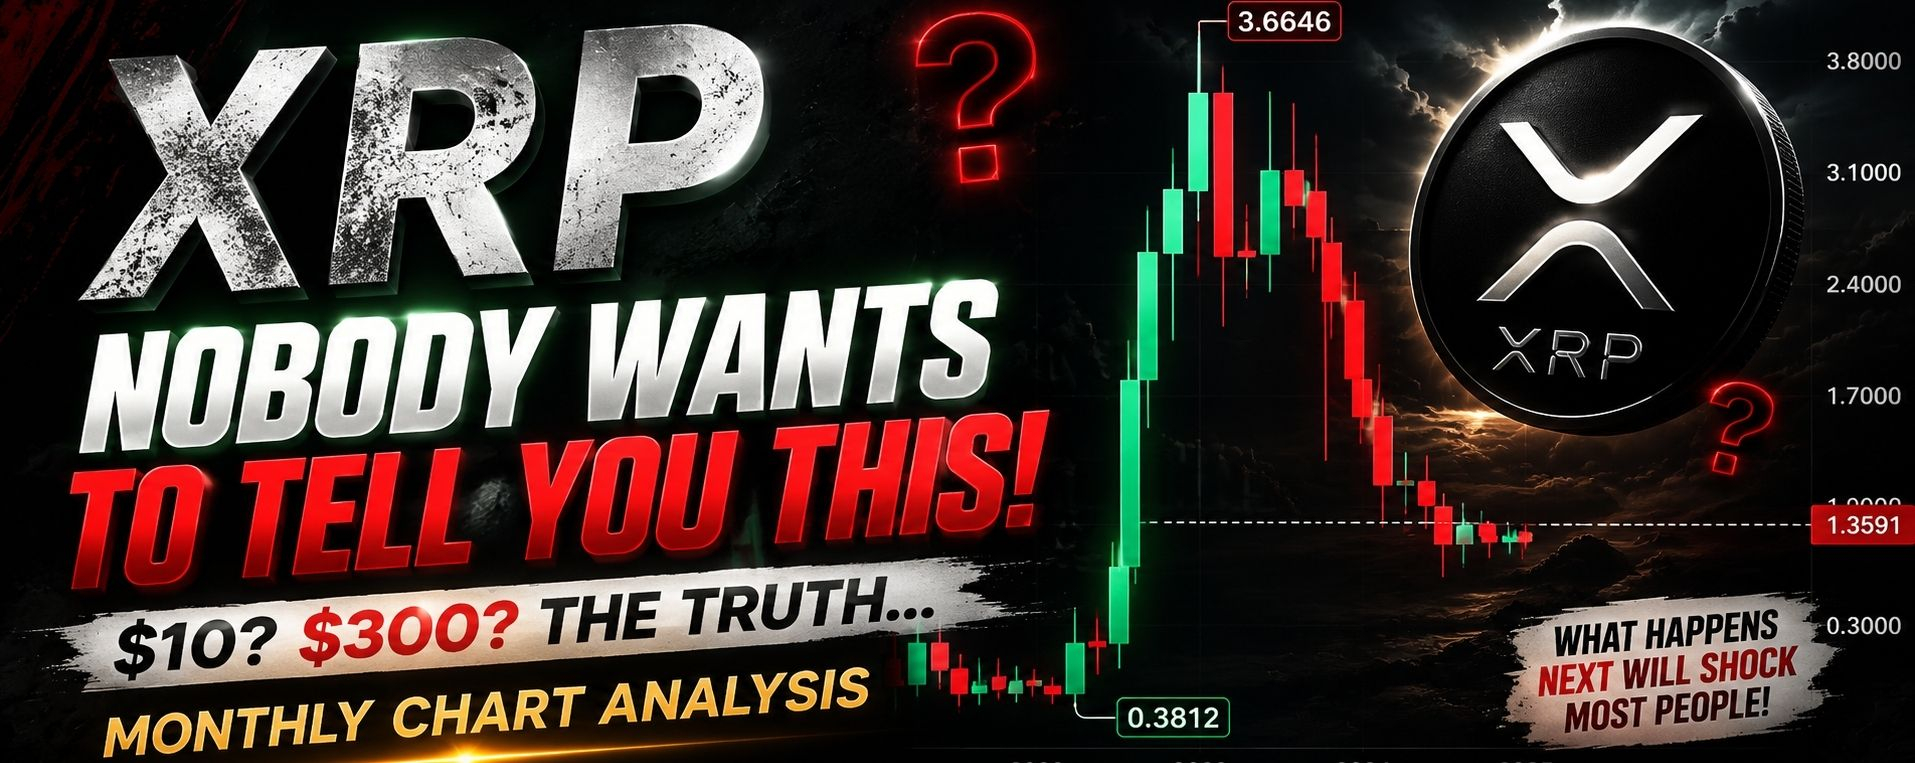
Everyone on social media is arguing over whether $XRP is heading to $10, $100, or even $300…
But the monthly structure is telling a very different story.
Take a closer look at the chart:
Massive expansion move from the $0.38 region
Explosive rally toward $3.66
Multiple rejection candles near the highs
Monthly closes gradually weakening
Momentum slowing instead of accelerating
That type of structure usually signals one thing:
The market may be entering a cooling or distribution phase — not a fresh price discovery breakout.
If XRP were truly preparing for a clean vertical move toward extreme price targets, the monthly chart would normally show:
Strong follow-through after breakout candles
Aggressive reclaim behavior
Expanding momentum and volume continuation
Less rejection pressure near resistance
Instead, sellers continue stepping in every time price pushes higher.
Could XRP revisit previous highs again? Absolutely — especially if the broader altcoin market remains strong.
But the nonstop $100–$300 predictions being thrown around right now are mostly emotion-driven narratives designed to generate attention and engagement.
Because one reality many posts ignore is this:
The higher XRP climbs, the more liquidity and market cap expansion becomes necessary to sustain those moves.
And that becomes increasingly difficult at larger valuations.
A common mistake retail traders make is becoming most bullish after huge green monthly candles because the move suddenly “feels safe.”
Experienced traders often do the opposite.
They become more cautious when momentum begins fading while public confidence keeps rising.
Based on the current monthly structure alone, XRP looks more like an asset losing momentum after a powerful expansion phase — not one preparing for an effortless straight-line rally toward fantasy targets.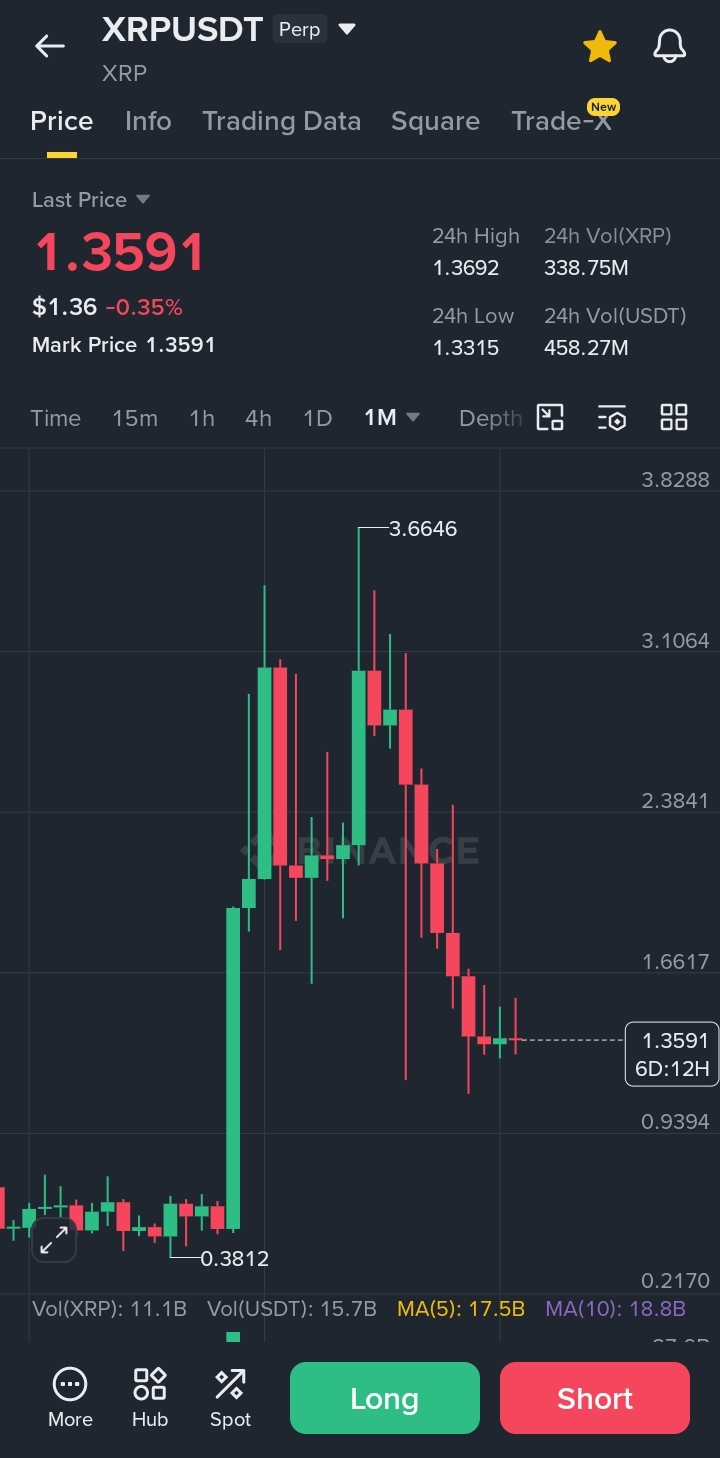
#XRP #Crypto #Bitco in #Altcoins #Trading #XRPArmy #CryptoMarket #TrendingTopic