Hi Crypto Family! 👋
While everyone is busy dreaming of $100k Bitcoin after the recent bounce, some major bearish signals are quietly forming in the higher timeframes (HTF). Let’s break down what the charts are actually telling us from a technical perspective.
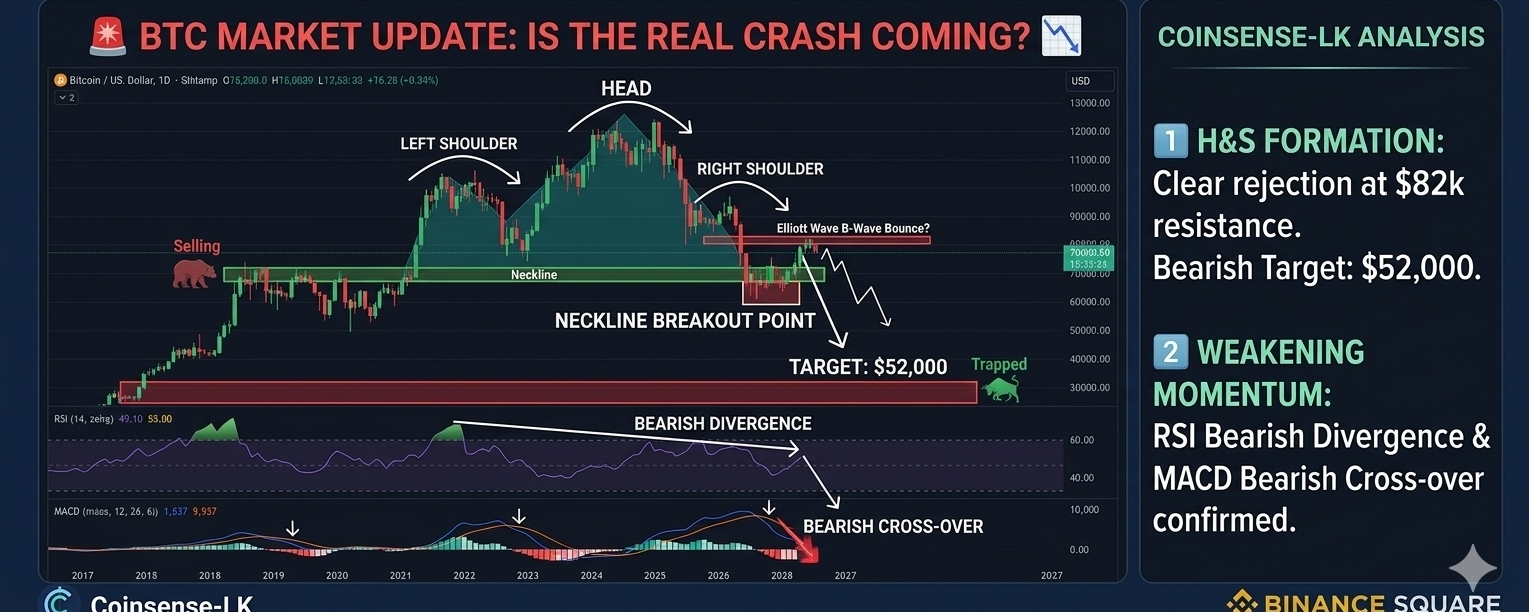
1️⃣ Head and Shoulders (H&S) Formation: Looking at the HTF charts, a clear Head and Shoulders pattern has been developing. After a strong push, the price ran directly into the $82k resistance level and faced a sharp rejection. If this pattern completes its textbook breakdown, the next major downside target is sitting right around $52,000.
2️⃣ Elliott Wave & Hidden Divergence: Top market analysts are also warning that this recent upward movement might just be a temporary "B-Wave Bounce." This is backed up by a clear Bearish Divergence on the RSI and a Bearish Cross-over on the MACD. In simple terms: the price went up, but the actual market momentum is weakening.
💡 The Smart Money Reality: The market loves to trap retail traders in a late-stage bullish frenzy to engineer liquidity before a real move. Jumping into long positions out of FOMO (Fear Of Missing Out) at these levels could be highly risky. Always prioritize strict risk management and protect your capital.
🎯 Next Major Support Target: $52,000
What’s your take on this? Are we visiting $52k first, or is $100k still on the table? Let me know in the comments below! 👇
#Bitcoin #BTC #CryptoAnalysis #TechnicalAnalysis #BinanceSquare #SmartMoneyConcepts #TradingTips #WhaleAlert