BTC si sta muovendo…fai attenzione
Sono stato chiaro nei miei video e post che tutti i segnali indicano che $BTC probabilmente sta per completare un modello di fondo locale qui
Quindi ho continuato a fare DCA e ho un bias rialzista a breve termine
Ma ecco due configurazioni (sia rialziste che ribassiste) che possiamo utilizzare come conferma per entrambi i lati
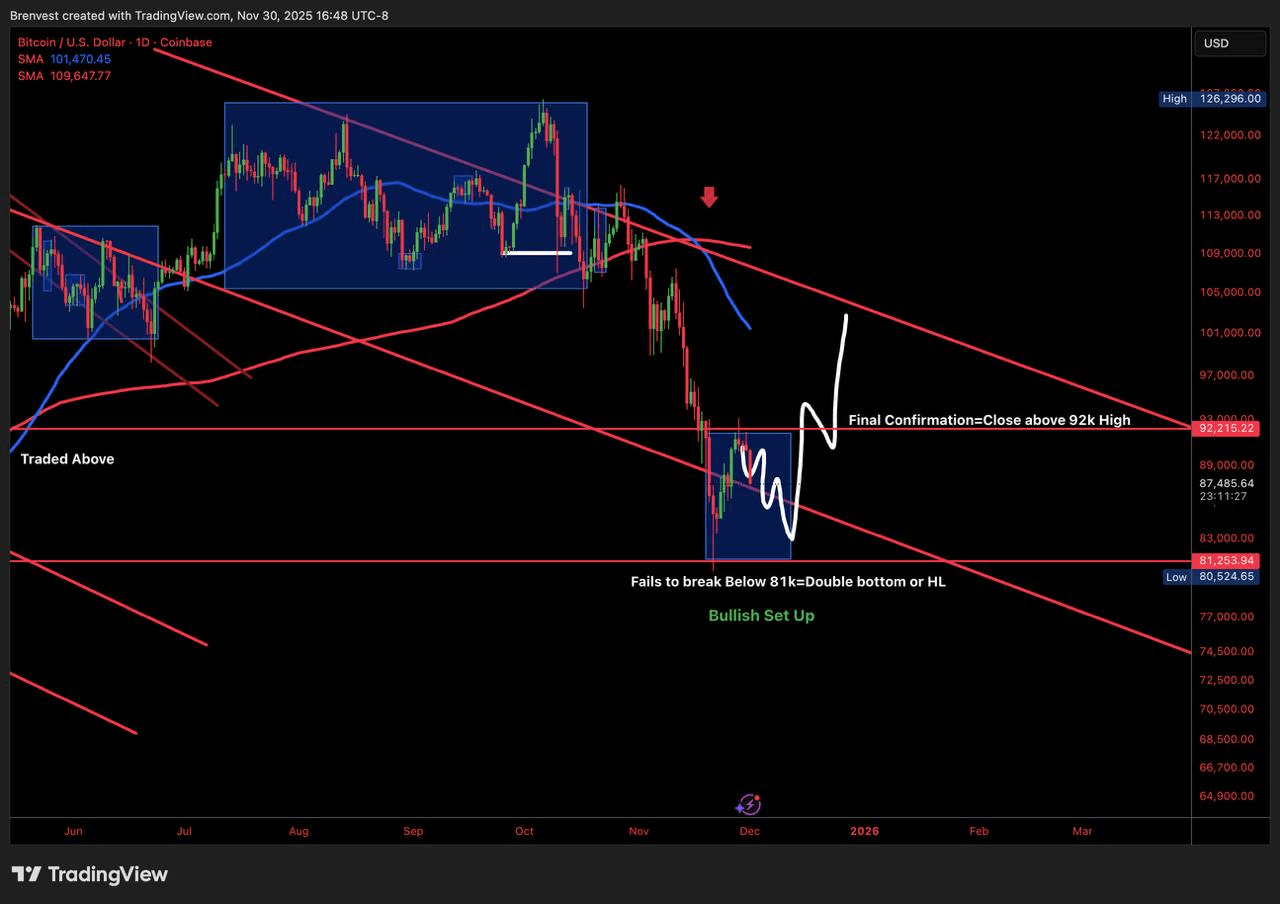
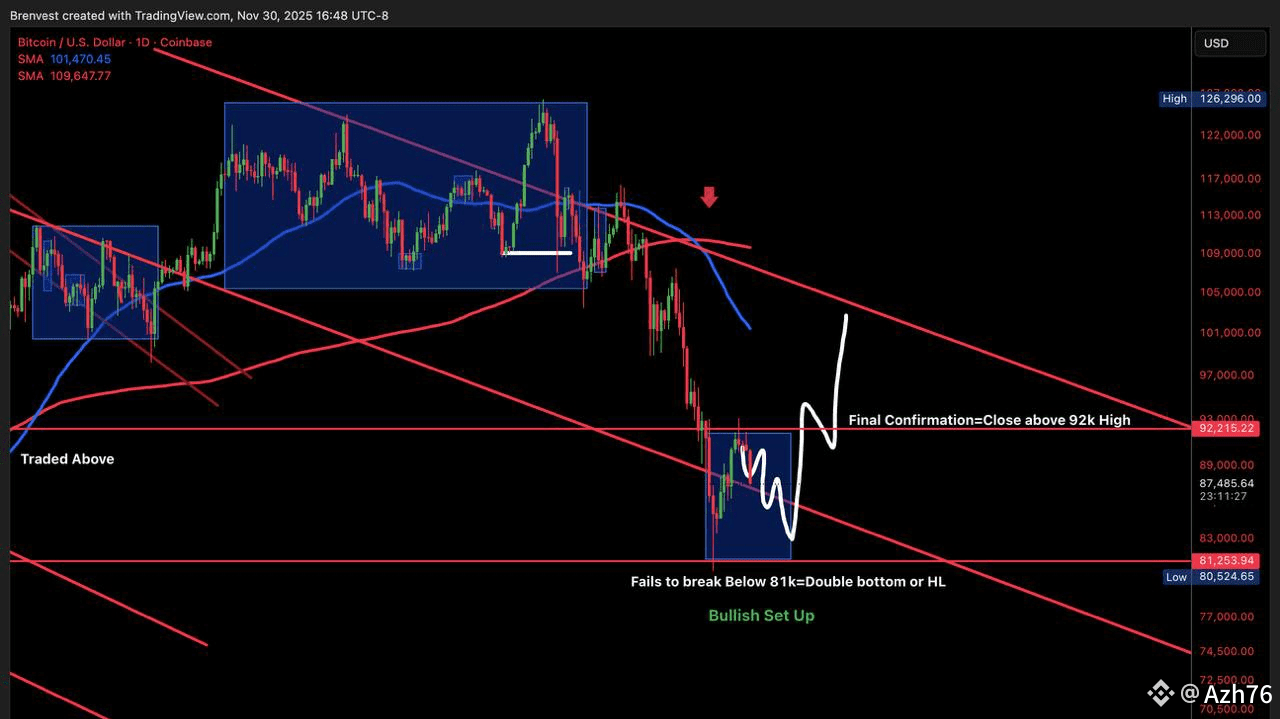
1. Configurazione rialzista: BTC torna a muoversi verso 81k (idealmente in modo lento e irregolare) ma non riesce a superare il minimo di 81k con candele giornaliere…confermando un doppio fondo e muovendosi più in alto
Conferma finale di questa configurazione: 2 candele giornaliere chiudono sopra il massimo di consolidamento di 93k
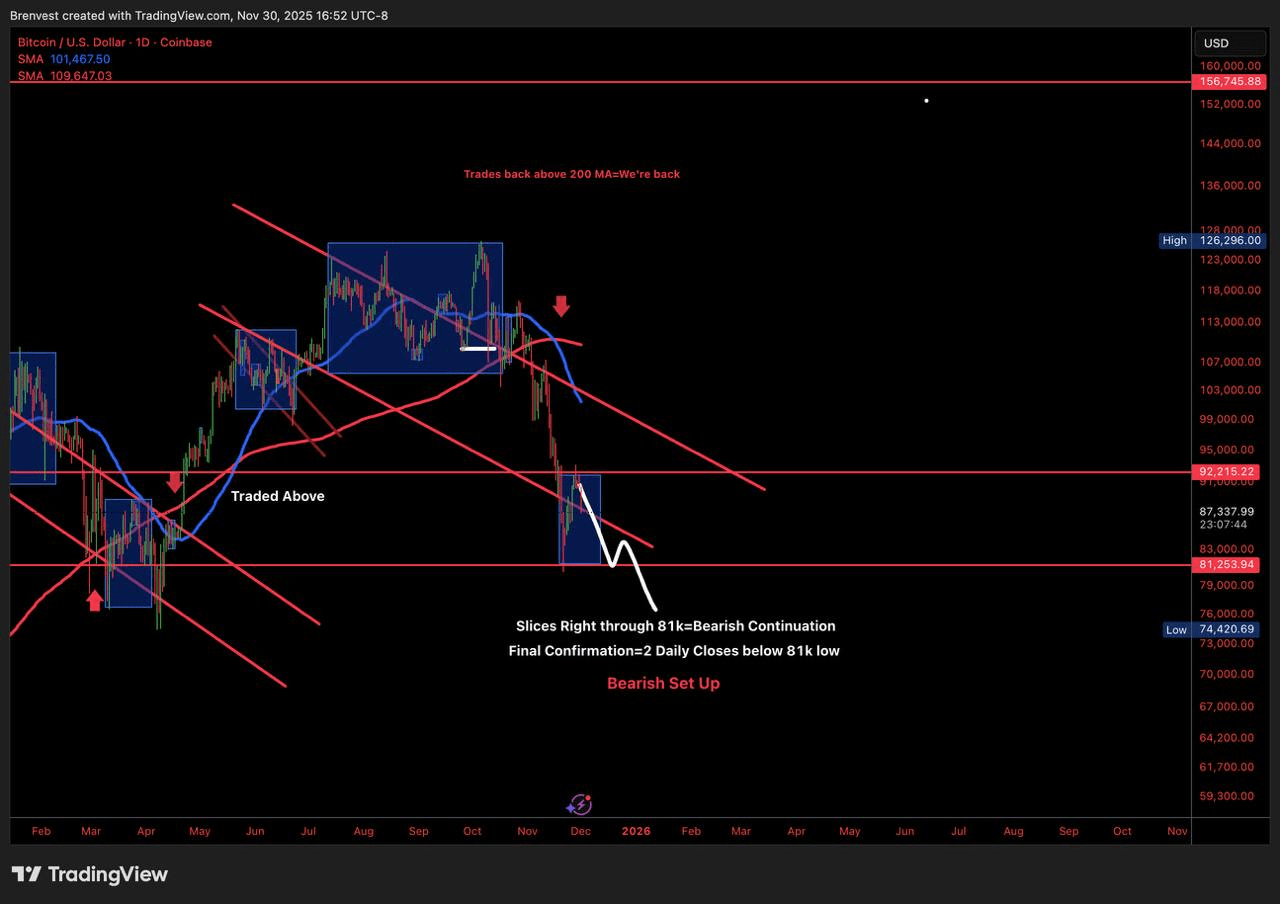
2. Set up ribassista: invece di scendere lentamente verso 81k e formare un doppio minimo… $BTC attraversa direttamente il minimo di 81k e conferma una continuazione ribassista verso i 70
Conferma finale di questo set up: 2 candele giornaliere rosse chiudono sotto 81k
Personalmente inclino fortemente verso il fatto che si stia formando un pattern di minimo di picco per #BTC (bias rialzista)
E vi darò sempre tutte le informazioni che sto osservando, e a cosa portano queste informazioni
ma voglio anche darvi set up oggettivi per entrambe le direzioni
Che si tratti solo di confermare la direzione o di andare long/short se è ciò che vi interessa (stai attento, è un ambiente difficile per la leva anche per i trader esperti)
Vediamo come si sviluppa mentre ci avviciniamo a 81k, e ovviamente aggiorneremo man mano che i set up progrediscono