I've been watching the XRP chart closely, and what stands out to me right now is how price is attempting to stabilize around the $1.13 area after a period of short-term selling pressure. Even though XRP is showing a modest gain on the day, the chart suggests that buyers and sellers are still battling for control.
One thing I noticed is that the price remains below the 60-period moving average, which is currently acting as resistance. In many cases, this tells us that the broader short-term trend is still cautious, and bulls need stronger momentum before a meaningful breakout can happen.
Volume is another interesting factor. During the recent dip, trading activity increased noticeably. This often indicates that market participants are paying attention to this price zone. If buyers continue to absorb selling pressure, XRP could attempt another move toward the recent high near $1.17. A successful break above that level could attract additional momentum traders.
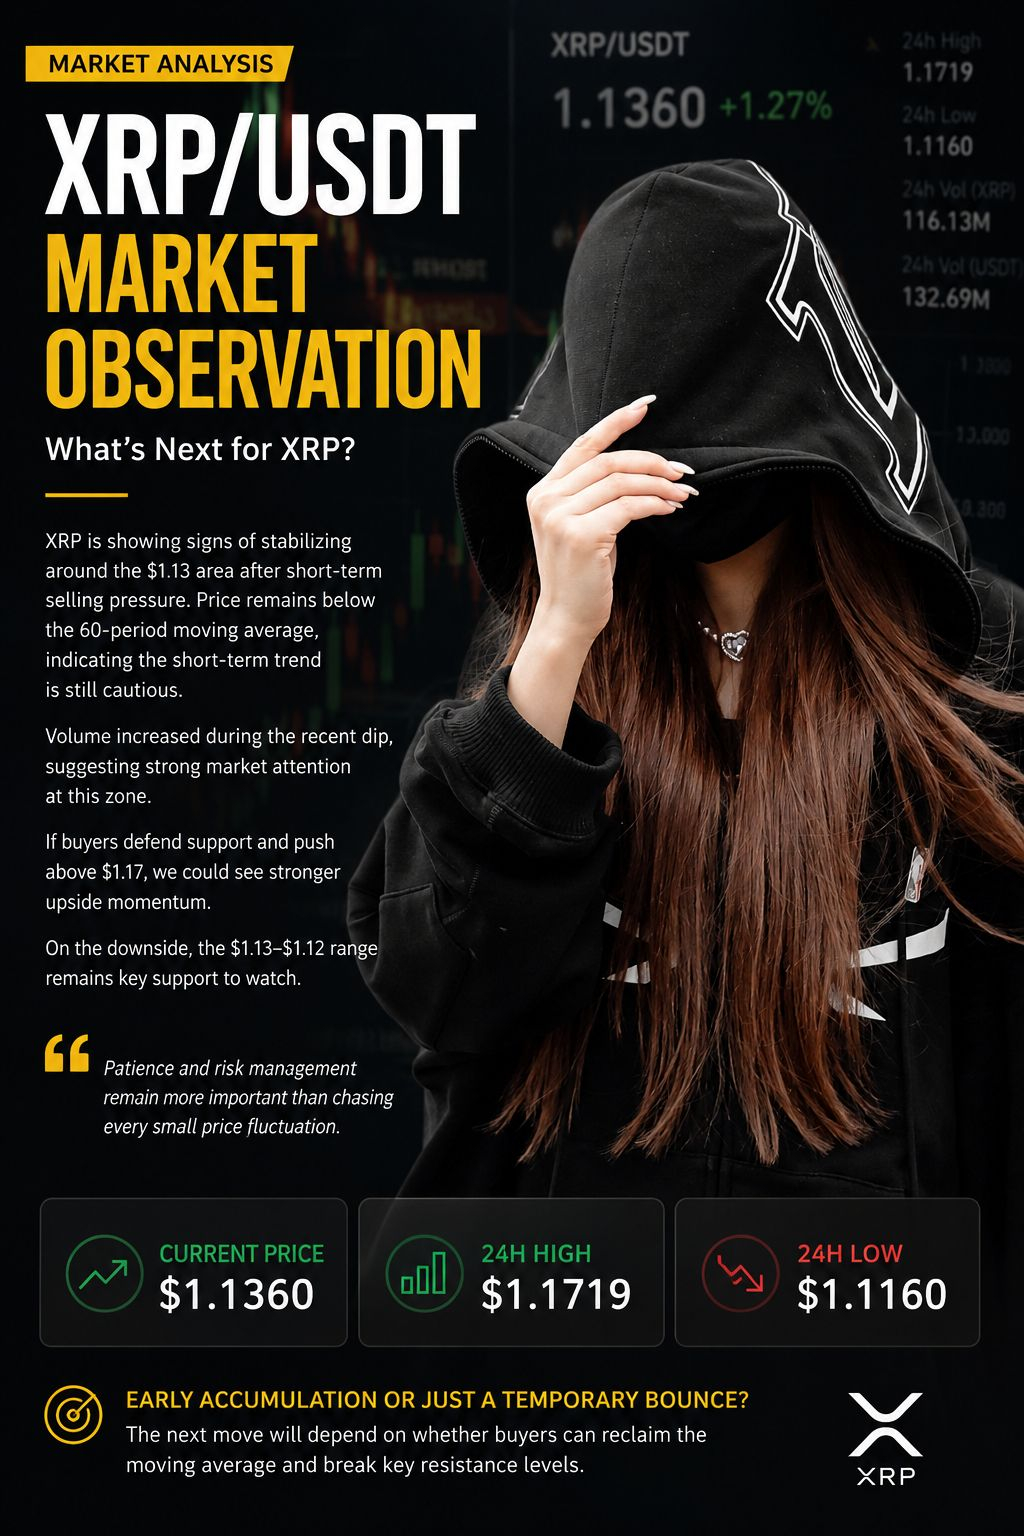
On the downside, the $1.13–$1.12 range appears to be the key support area. If this zone fails to hold, traders may see another wave of short-term weakness before a stronger base is formed.
My current view is that XRP is in a consolidation phase rather than a clear trend. The next major move will likely depend on whether buyers can reclaim the moving average and push above nearby resistance levels. Until then, patience and risk management remain more important than chasing every small price fluctuation,.
Current XRP Price: $1.1360
24H High: $1.1719
24H Low: $1.1160
What do you see here—early accumulation or just a temporary bounce before another test of support?
