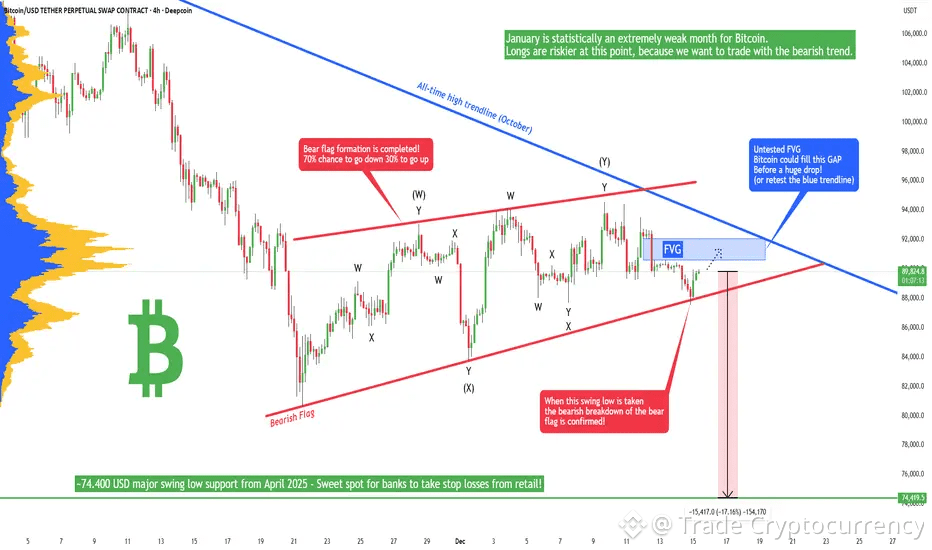
Bitcoin has just completed its bearish flag formation. What now? The probability of going down is now around 70%, while the probability of going up is only 30%. Many times we see a bullish breakout of a bear flag. How does it look? Something like that:
We see that for a bullish breakout, the bulls need to completely go above the flag's resistance, which is much harder than simply going down, especially in a strong bear market, like in this Bitcoin's case.

Bitcoin's price and development are completely controlled by the banks and huge institutions that control this planet. To make money, you have to identify their actions on the chart.
On the chart we can also see a completely unfilled FVG (Fair Value GAP). Precisely between 90600 and 92060. There is a possibility for Bitcoin to partially or completely fill this GAP before starting the upcoming drop! Longs are riskier at this point, because we want to trade with the bearish trend. But if the price increases in the short term, we can have a much better entry point for our short position on futures. It's also a possibility to retest the long-term blue trendline from the all-time high.
From the Elliott Wave point of view, this bear flag seems to be a complex corrective pattern. To be honest, I don't see any signs of strength, such as an impulse wave or a leading diagonal wedge pattern. I am currently bearish on Bitcoin, and I expect a pretty significant drop in the coming weeks! Especially January is statistically an extremely weak month for Bitcoin.
Trade at your own Risk 👍
Best Regards, Trade Cryptocurrency
Stay Tuned for Further Updates.