Ethereum ($ETH ) is currently in a corrective phase based on the Elliott Wave Theory. Let’s break down what the structure shows 👇
🌀 Elliott Wave Structure
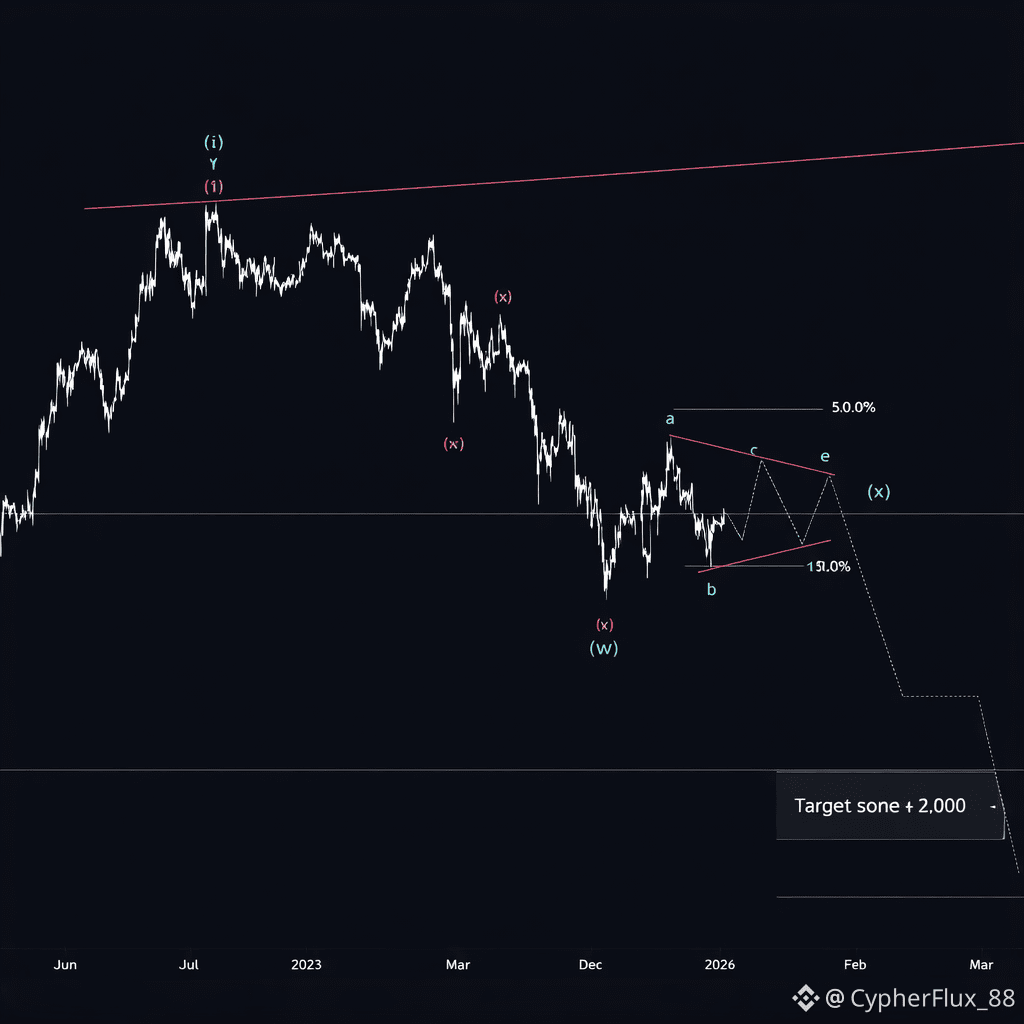
$ETH has completed a major Wave (1) impulse at the recent high.
The market is now forming a Corrective Wave (2).
This correction appears to be a complex (w)-(x)-(y) pattern — typically longer and more time-consuming.
💎 Current Price Action
The current move represents a mid-correction bounce labeled as Wave (x).
Price is consolidating inside a Symmetrical Triangle (a-b-c-d-e).
Ethereum is hovering around $3,000, struggling to find clear direction.
📈 Key Levels to Watch
Resistance: $3,300 – $3,500 (upper boundary of the triangle).
Support / Targets: A breakdown from the triangle could lead to Wave (y) unfolding lower.
Potential Landing Zones: $2,060 and $1,700 regions — likely bottom areas for Wave (2).
💡 Trading Insights
🐻 Bearish Outlook: A drop below triangle support may confirm continuation of the correction toward the $2,000 zone.
🐂 Bullish Outlook: A sustained breakout above $3,500 would invalidate the corrective count and suggest the uptrend resumes.
⚠️ Disclaimer:
This is not financial advice (NFA). Crypto markets are highly volatile. Always Do Your Own Research (DYOR) before entering any trade.
#ETH #ElliottWave #CryptoAnalysis #TradingSetup