Il modo più comune per visualizzare i prezzi è attraverso i grafici a candele. Ogni "candela" racconta una storia di ciò che è accaduto in un determinato periodo di tempo (ad esempio 1 ora o 1 giorno).
Il Corpo: La parte spessa che mostra la differenza tra il prezzo di apertura e quello di chiusura.
Il Wick (o Ombra): Le sottili linee che sporgono dall'alto e dal basso, che indicano quanto in alto e in basso è arrivato il prezzo durante quel periodo.
Candela Verde/Bianca: Il prezzo è salito (il prezzo di chiusura è più alto di quello di apertura). 📈
Candela Rossa/Nera: Il prezzo è sceso (il prezzo di chiusura è più basso di quello di apertura). 📉
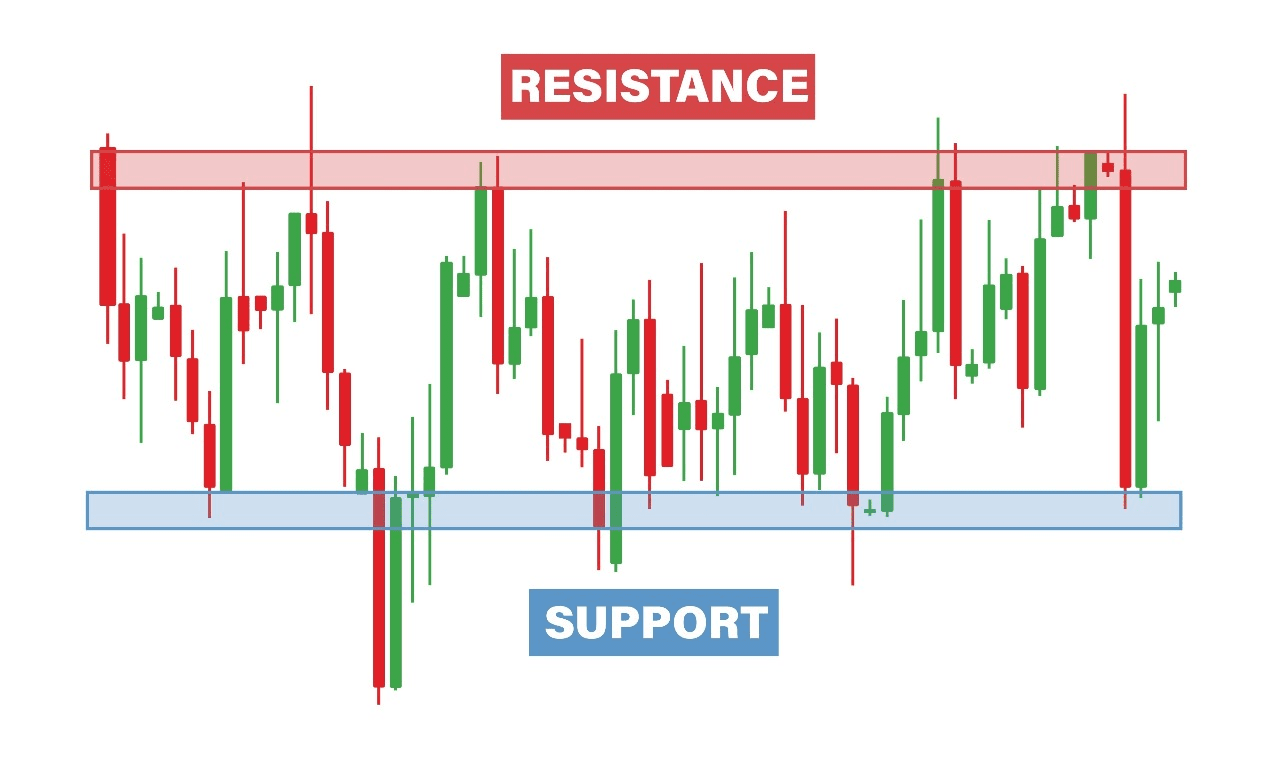
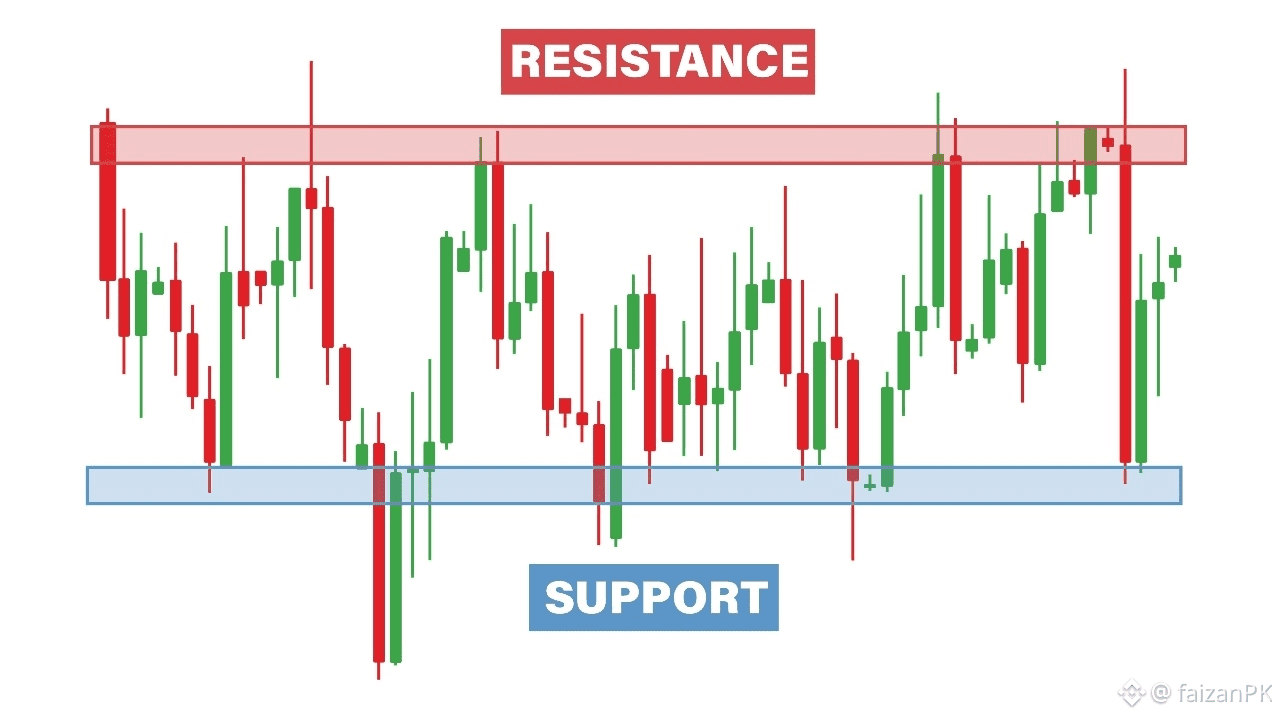
Supporto e resistenza
La prima cosa che un trader esperto fa è identificare i "pavimenti" e i "soffitti" sul grafico.
Supporto (il pavimento): Un livello di prezzo in cui una tendenza al ribasso tende a fermarsi a causa di una concentrazione di domanda d'acquisto. 🟢
Resistenza (il soffitto): Un livello di prezzo in cui un rialzo tende a fermarsi mentre i trader iniziano a vendere. 🔴
Il supporto 🟢 agisce come un pavimento perché ci sono abbastanza acquirenti a quel prezzo da fermare il "coltello che cade" e spingere il prezzo nuovamente verso l'alto.
Quando osservi un grafico, vedrai spesso il prezzo colpire più volte quel pavimento. Più volte rimbalza senza rompere, più il supporto viene considerato "forte".
La resistenza 🔴 è un livello di prezzo in cui molti trader hanno impostato ordini di "vendita". Quando il prezzo sale e raggiunge questo soffitto, la pressione di vendita è di solito troppo elevata perché il prezzo possa continuare a salire, quindi scende nuovamente.
Mettilo insieme: Il "Breakout"
La parte più eccitante per un trader è il breakout. Avviene quando il prezzo finalmente raccoglie abbastanza "momento" (potere d'acquisto) per sfondare il soffitto di resistenza. 🔨
Consiglio professionale: Una volta che il prezzo supera la resistenza, quel vecchio soffitto diventa spesso un nuovo supporto pavimento.