
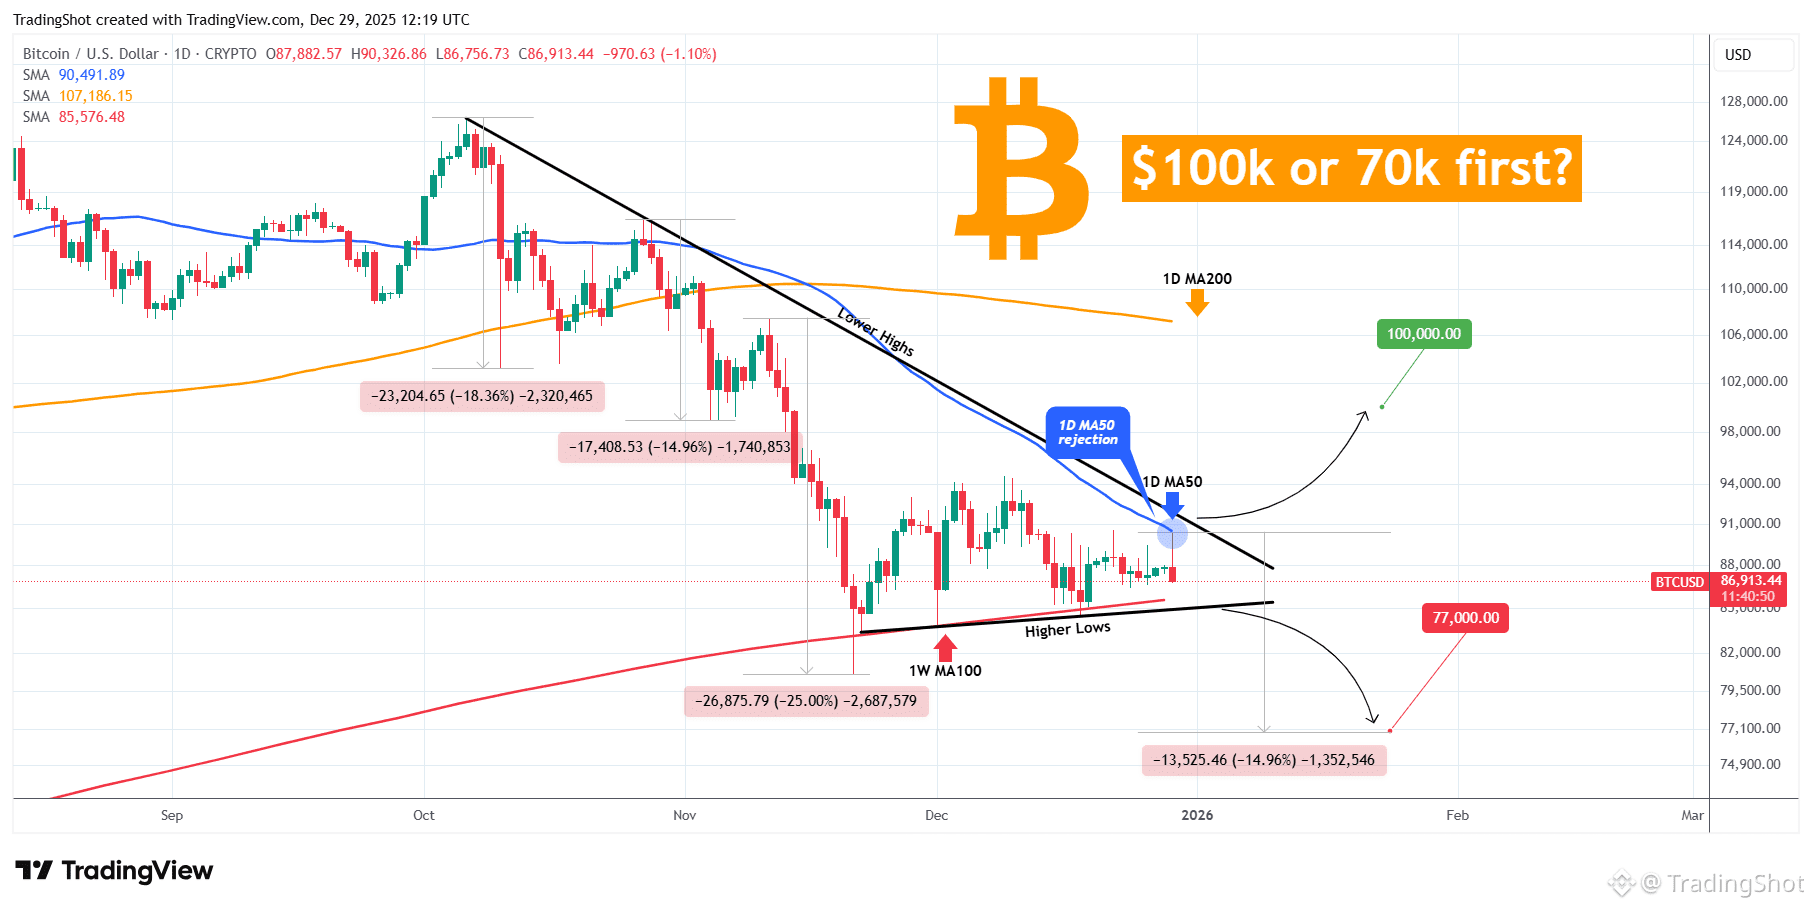
Bitcoin (BTCUSD) touched its 1D MA50 (blue trend-line) today for the first time after 2 months (since October 28) and immediately got rejected. This is potentially an early sign that not only does the market remain bearish, but it prepares a strong move downwards.
However, that can't be confirmed as long as the 1W MA100 (red trend-line) holds, which as you see has been tested and held (closed all candles above it) 3 times since November 21.
The above mentioned MA trend-lines go along a Lower Highs and Higher Lows trend-line respectively, acting as the Resistance and Support of the market since its October All Time High (ATH).
As a result, if the price breaks above the Lower Highs trend-line, we expect that counter-trend rally in early 2026 to test the 1D MA200 (orange trend-line) and this at least $100000, like BTC did during all its previous Bear Cycles. If on the other hand the Higher Lows trend-line breaks first, we expect a minimum -14.96% decline (the least drop sequence since the start of the Bear Cycle) targeting $77000.
Please LIKE 👍, FOLLOW ✅, SHARE 🙌 and COMMENT ✍ if you enjoy this idea!
