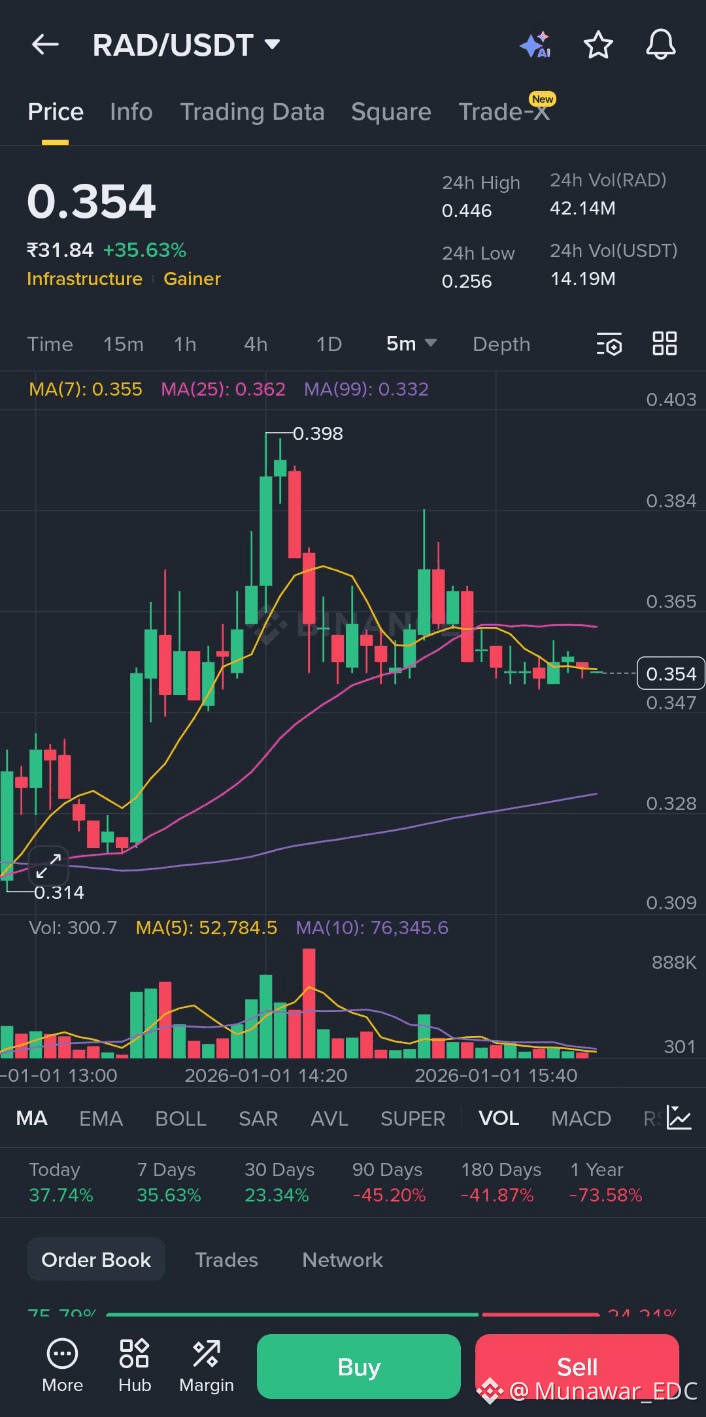
It looks like you're tracking Radworks ($RAD) on a 5-minute candlestick chart. It’s currently showing a significant 24-hour gain of over 35%, though the price is currently seeing some consolidation after a peak.
Here is a breakdown of what the chart is telling us right now:
Key Technical Indicators
Price Action: The price hit a recent high of $0.398 but has since pulled back to $0.354. It is currently sitting right around its short-term moving average.
Moving Averages (MA):
MA(7) - Yellow: $0.355. The price is currently trading just below this, suggesting a momentary loss of upward momentum.
MA(25) - Purple: $0.362. This is acting as immediate overhead resistance.
MA(99) - Violet: $0.332. This is your "safety net" support level. If the price drops, bulls will want to see it stay above this line.
Volume: There was a massive spike in volume during the pump to $0.398, but the volume bars at the bottom are now decreasing (tapering off). This usually indicates the initial "hype" or buying pressure is cooling down.
What to Watch For
Scenario Level to Watch What it means
#Bullish (Up) $0.365 If it breaks back above the MA(25), it may attempt another run at $0.40.
Neutral (Sideways) $0.345 - $0.360 The price might "bleed" sideways while the market decides its next move.
#Bearish (Down) $0.332 A drop below the MA(99) could signal that the 35% pump is fully retracing.
