The recent market performance of ChainOpera AI (COAI) has presented a complex environment for traders and analysts alike, characterized by extreme volatility, significant capitulation events, and a subsequent period of consolidation that suggests the market is deciding on its next directional bias. The interplay between aggressive selling pressure observed earlier in the cycle and the emerging accumulation patterns on the lower timeframes has created a pivotal moment for the asset. As we look at the current price action, which is hovering around the 0.4287 mark, it is essential to deconstruct the technical realities shown on the chart while integrating the broader market sentiment driven by recent headlines. The market is currently digesting a massive correction, and the transition from a distribution phase to a potential accumulation phase is the primary focal point of this analysis.
Market Snapshot
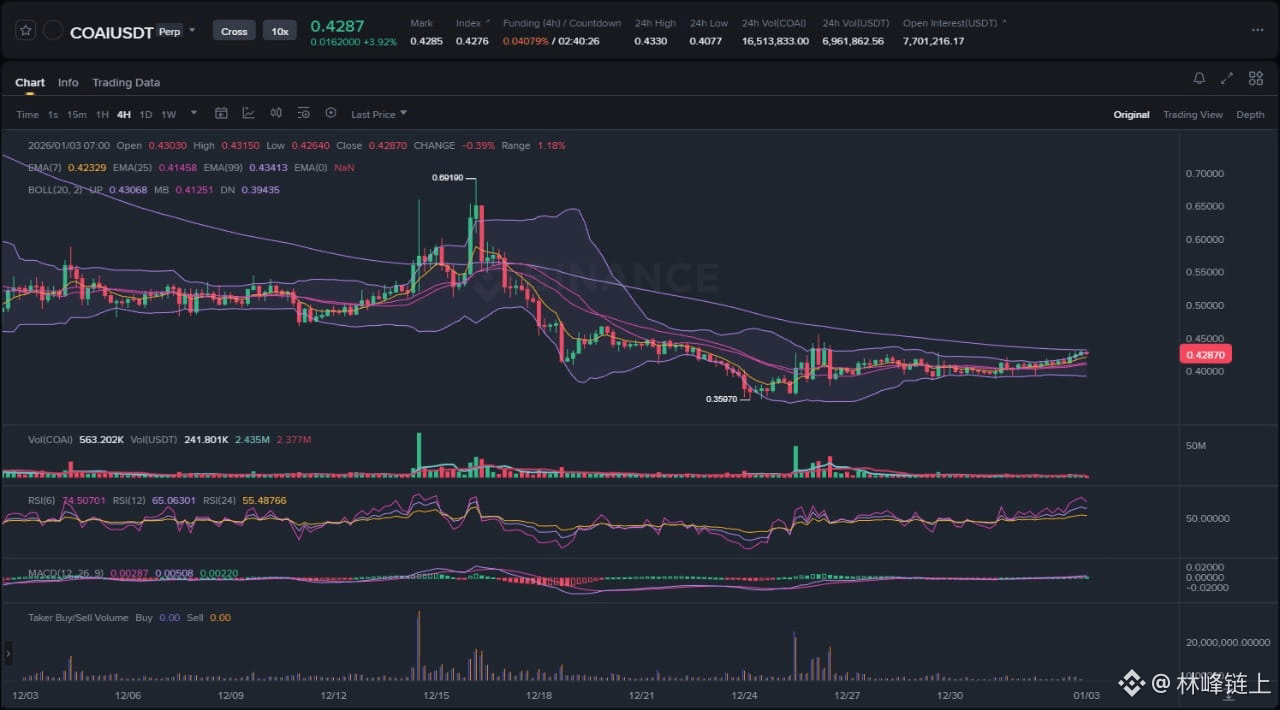
At the time of writing, COAI is trading at approximately 0.4287 USDT. The asset has experienced a significant drawdown from its local swing high of 0.69190, representing a substantial contraction in valuation that aligns with the bearish sentiment seen in recent news cycles. The price action is currently compressed within a narrowing range, bounded by the upper Bollinger Band at 0.4306 and the lower band at 0.3943. This compression is a classic precursor to volatility expansion. The 4-hour chart reveals that the price is attempting to reclaim the exponential moving averages (EMAs), specifically testing the 7-period and 25-period EMAs as dynamic support levels. Volume profiles show a decline in trading activity compared to the capitulation volume seen during the drop to 0.3597, indicating that selling pressure may be exhausting, but buying conviction has not yet fully returned. The RSI is hovering in neutral territory, neither overbought nor oversold, suggesting that momentum is resetting for the next move.
Chart Read: Price Action and Structural Analysis
The technical structure visible on the 4-hour chart tells a story of a violent correction followed by a tentative stabilization. The dominant feature of the chart is the impulsive bearish move that took the asset from the 0.69 region down to the 0.35 region. This move broke several key structural support levels, flipping the market bias to bearish in the medium term. However, the reaction at the 0.35970 low is critical. This level acted as a demand zone where buyers stepped in to absorb the selling pressure, leading to a bounce that has since evolved into a consolidation pattern.
Currently, the price action is forming what appears to be a potential rounded bottom or a bear flag, depending on the direction of the breakout. The price is tightly hugging the upper rail of the Bollinger Bands. In technical analysis, when price rides the upper band during a consolidation, it can indicate underlying strength and a desire to break upward, known as a "band walk." However, the proximity of the EMA 99 (the purple line) overhead acts as a significant resistance layer. The market is effectively trapped between support at the recent lows and resistance at the trend-following moving averages.
The volume oscillator and MACD provide further context. The MACD histogram has turned slightly positive, and the signal lines are converging, hinting at a potential bullish crossover. If this crossover is sustained, it would confirm a shift in momentum from bearish to bullish. However, the lack of significant volume spikes during this recovery phase suggests that the current move is driven more by a lack of sellers than an influx of aggressive buyers. This low-volume rise is often fragile, making the market susceptible to sudden reversals if liquidity is not injected soon.
News Drivers and Sentiment Analysis
Integrating the recent news digest with the technical setup provides a clearer picture of the psychological state of the market. The headlines surrounding COAI are polarized, reflecting the confusion and uncertainty seen in the price action.
The first major theme is "Capitulation and Fear." Reports indicate that COAI has faced drops ranging from 31% to nearly 90% in various timeframes, with headlines screaming about a "brutal drop" and "fragile recovery." This aligns perfectly with the chart's steep decline from 0.69 to 0.35. This news cycle confirms that the market has undergone a severe liquidity flush. In trading theory, such extreme negative sentiment often marks a local bottom, as the "weak hands" have already sold, leaving the asset in the hands of longer-term holders or opportunistic accumulators.
The second theme is "Speculative Optimism." Despite the crash, headlines from BeInCrypto suggest a potential "+100% rally" and mention that the asset is facing a "key test." This indicates that while the trend is down, the market sentiment is anticipating a mean reversion play. When an asset falls 80-90%, a bounce of 100% is often just a retracement to previous support levels (now resistance) rather than a full trend reversal. This aligns with the chart's potential to revisit the 0.50 or 0.55 levels, which would represent a significant percentage gain from the lows without necessarily breaking the macro bearish structure.
The third theme is "Liquidity Pockets." The news mentions strong liquidity at higher valuations. While the specific dollar figures in the news (referencing $4 or $5) differ from the chart's 0.42 USDT level likely due to different denominations or market cap parities, the principle remains: there is trapped liquidity above the current price. Market makers often drive price toward these liquidity pockets to facilitate order execution. If the sentiment shifts, the "crash" narrative could quickly flip to a "recovery" narrative, fueled by short covering.
Scenario A: Bullish Continuation and Reversal (The Primary Outlook)
For the bullish scenario to materialize, COAI must successfully convert the current consolidation into a launchpad. The primary requirement is a decisive 4-hour candle close above the immediate resistance cluster at 0.4400. This level coincides with the upper Bollinger Band and the immediate EMA resistance.
If price can reclaim 0.4400 with increasing volume, it would validate the 0.35970 level as a hard bottom. The next objective for the bulls would be the 0.5000 psychological level, which previously acted as support before the breakdown. A move to 0.5000 would likely trigger a squeeze of late short positions, fueling further upside momentum.
In this scenario, traders should look for the MACD to expand into positive territory and for the RSI to break above 60, signaling growing bullish momentum. The target for this move would be the 0.5500 to 0.6000 range, effectively retracing 50% to 61.8% of the recent drop. This aligns with the "100% rally" sentiment mentioned in the news, representing a substantial recovery from the lows. The key driver here would be a shift in narrative from fear to "fear of missing out" (FOMO) as the price reclaims lost ground.
Scenario B: Bearish Rejection and Breakdown (The Alternative Outlook)
The alternative scenario considers the possibility that the current consolidation is merely a pause in the dominant downtrend—a "dead cat bounce" or a bear flag. In this view, the low volume accompanying the rise to 0.4287 is a warning sign. If the price fails to break above the EMA 99 and is rejected at the 0.4350 level, it would signal that sellers are still in control and are using this liquidity to offload more positions.
The invalidation point for the current recovery is a loss of the 0.4000 support level. A 4-hour close below 0.4000 would open the door for a retest of the 0.35970 lows. If that low fails to hold, the market could enter a price discovery phase to the downside, targeting lower liquidity zones.
This scenario aligns with the "fragile recovery" narrative. If the broader crypto market faces headwinds or if specific project news turns negative, the fragile confidence built over the last few days could evaporate. The Bollinger Bands would expand downward, and the RSI would drop back below 40, confirming a resumption of the bearish trend.
What to Watch Next
Traders and investors should focus on three specific actionable signals in the coming 24 to 48 hours.
First, watch the Volume Profile. The current low-volume consolidation is unsustainable. A breakout in either direction will likely be preceded or accompanied by a significant spike in volume. If price moves up on low volume, be wary of a fakeout. If price moves up on high volume, it adds credibility to the reversal.
Second, monitor the Bollinger Band Width. The bands are contracting, which historically precedes a violent move. Watch for the bands to start widening again. The direction of the first impulsive candle that causes the bands to widen will likely dictate the trend for the next week.
Third, observe the reaction at the EMA 99. The purple line on the chart is acting as a dynamic ceiling. A clean break above this line changes the market structure. Repeated wicks touching this line and failing to close above it indicate strong selling pressure.
Risk Note
It is crucial to remember that COAI is demonstrating high volatility characteristics. The news mentions drops of over 80%, which highlights the extreme risk associated with this asset. Technical levels can be overrun during news-driven events or liquidity cascades. Position sizing should be adjusted to reflect this volatility, and stop-losses should be respected to preserve capital. The recovery is nascent and unconfirmed until key resistance levels are reclaimed.
In conclusion, ChainOpera AI is at a technical inflection point where the tension between a bearish macro trend and a bullish short-term recovery setup is at its peak. The next 48 hours will likely determine whether the asset begins a meaningful recovery toward 0.50 or succumbs to the prevailing downtrend.