The cryptocurrency market is often defined by periods of dormancy followed by explosive volatility, and the current price action observed on the TURBO/USDT pair serves as a textbook example of this market cycle. After a prolonged period of consolidation and price compression, TURBO has executed a significant structural shift, characterized by a high-momentum breakout that has attracted considerable attention from both retail and institutional market participants. This analysis aims to dissect the technical nuances of this move, correlate them with the latest fundamental developments regarding the project's integration with the Stellar network, and provide a probabilistic framework for potential future price trajectories. By combining granular chart analysis with the broader macroeconomic and project-specific news cycle, we can derive a clearer understanding of the forces currently driving TURBO's valuation.
Market Snapshot
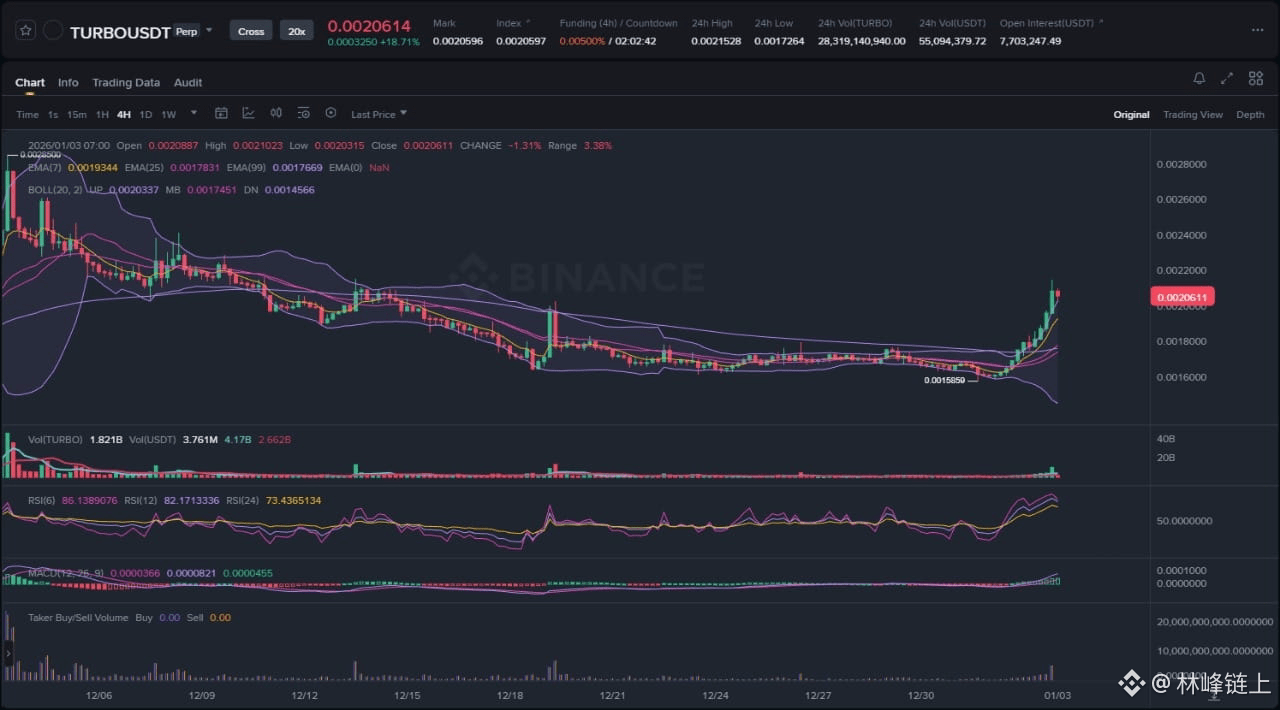
The attached 4-hour chart for TURBO/USDT illustrates a decisive transition from a low-volatility accumulation phase to a high-volatility expansion phase. For several weeks, the asset traded within a tight horizontal range, roughly between 0.0016 and 0.0017 USDT. This period was characterized by contracting Bollinger Bands and flattening Exponential Moving Averages (EMAs), signaling a drying up of liquidity and a balance between buyers and sellers. However, recent sessions have shattered this equilibrium. The asset has surged to trade above the 0.0020 level, representing a substantial percentage gain in a short timeframe. This move is accompanied by a visible expansion in trading volume, suggesting that the breakout is backed by genuine market participation rather than low-liquidity manipulation. The current market structure is unequivocally bullish in the immediate term, though the velocity of the move raises questions regarding sustainability and the potential for mean reversion.
Chart Read
A technical deep dive into the provided chart reveals several critical developments that confirm the strength of the current trend while highlighting potential areas of overextension.
First, the most dominant feature is the volatility expansion. The Bollinger Bands, which had been tightly squeezed during the consolidation phase around mid-December, have now expanded aggressively. The price action is currently "riding the upper band," a classic signal of a strong impulsive trend. In technical analysis, a band squeeze is often a precursor to a significant move, and the direction of the breakout usually dictates the trend for the subsequent weeks. The violent upward expansion confirms that bulls have seized control of the order book.
Second, the Moving Average convergence/divergence structure is highly supportive of the bullish bias. The chart displays a cluster of EMAs that have recently fanned out in a bullish alignment. The shorter-term EMAs have crossed above the longer-term averages, creating a layer of dynamic support beneath the current price action. This aligns perfectly with the "Golden Cross" mentioned in recent market reports. The separation between these moving averages indicates increasing momentum; however, the wideness of the gap between the current price (0.00206) and the baseline EMAs suggests the price is becoming extended. Assets rarely deviate from their mean for extended periods without a pullback or a period of sideways consolidation to allow the averages to catch up.
Third, the Relative Strength Index (RSI) is flashing a warning signal despite the bullish price action. The RSI is currently reading above 86, which is deeply into overbought territory. While an RSI above 70 indicates strong momentum, readings approaching 90 often precede a corrective move or a "cooling off" period. It is important to note that in strong trending markets, oscillators can remain overbought for longer than anticipated, trapping counter-trend traders. However, the confluence of an 86 RSI and a price trading significantly outside the standard deviation of the mean warrants caution for immediate entries.
Finally, the volume profile shows a distinct increase on the breakout candles compared to the dormant period in mid-December. This volume validation is crucial. A breakout on low volume is often a "fakeout" or a liquidity trap. Conversely, the rising volume bars seen here suggest that new capital is entering the market to support higher prices, likely driven by the convergence of technical signals and fundamental news.
News Drivers
The recent price appreciation is not occurring in a vacuum. A synthesis of the latest three news items reveals a dual-engine driver for TURBO: technical validation and fundamental utility expansion.
The first major theme is the Technical Catalyst. Reports from The Currency Analytics and AMBCrypto highlight a 35% surge fueled by a "Golden Cross" and spiking volume. A Golden Cross occurs when a short-term moving average crosses above a long-term moving average, typically the 50-day and 200-day. This is a lagging but widely watched indicator that often triggers algorithmic buying bots and trend-following funds. The news explicitly links the price surge to this technical event. The fact that media outlets are reporting on this specific technical setup creates a feedback loop: traders read about the Golden Cross, buy the asset, and further validate the trend. However, the AMBCrypto report also introduces a note of caution, suggesting the boost could precede a decline. This aligns with the "sell the news" phenomenon often seen in crypto, where early accumulators use the liquidity generated by latecomers to exit their positions.
The second, and perhaps more significant theme, is Fundamental Utility via Real World Assets (RWA). The news regarding Stellar backing Turbo Energy in a $74 billion tokenized clean power drive is a massive fundamental shift. This partnership moves TURBO away from being a purely speculative asset and positions it within the burgeoning RWA and green energy narrative. By launching tokenized debt financing on the Stellar network, the project is tapping into institutional-grade infrastructure. This is bullish for the long-term valuation of the asset as it introduces a utility value floor. In a market that is increasingly favoring projects with tangible real-world applications, this connection to a $74 billion sector provides a narrative that can sustain interest beyond the initial technical breakout.
When combining these themes, the outlook is structurally bullish. The technicals (Golden Cross) are providing the immediate liquidity and volatility, while the fundamentals (Stellar/Energy) are providing the justification for longer-term holding. However, the conflict between the "overbought" technicals and the "positive" news flow suggests a potential short-term distribution phase where smart money might take profits into the buying frenzy caused by the headlines.
Scenario A: Bullish Continuation (The Flag and Fly)
For the bullish primary scenario to play out, TURBO needs to convert the breakout into a sustainable trend rather than a parabolic spike. In this scenario, we would expect the price to enter a brief period of consolidation, forming a "bull flag" or "pennant" structure on the 4-hour chart. This consolidation should ideally hold above the 0.00185 - 0.00190 region. This level represents the previous resistance that should now flip to support (SR Flip).
If the price can maintain this level while the RSI cools off from 86 down to the 60-70 range, it would indicate that the market is absorbing the selling pressure without surrendering significant ground. A successful defense of the 0.00190 level, followed by a breakout above the current local high of 0.00210, would open the door for a continuation move. The next logical targets would be derived from Fibonacci extensions, likely aiming for the 0.00240 - 0.00250 zones. This scenario relies on volume remaining consistent and the "Clean Power" narrative continuing to circulate in social dominance metrics.
Scenario B: Bearish Invalidation (The Mean Reversion)
The alternative scenario considers the risk of a "Bull Trap" or an aggressive mean reversion. Given the vertical nature of the recent move and the extreme RSI reading, there is a probability that the breakout was a liquidity grab designed to fill large sell orders. In this scenario, the price fails to hold the 0.00190 support level and rapidly retraces back into the previous trading range.
A breakdown below 0.00175 would be the critical invalidation signal. Re-entering the previous accumulation block would suggest that the breakout lacked genuine demand and was primarily driven by speculative leverage that is now being flushed out. If this occurs, the "Golden Cross" narrative could turn into a "lagging trap," where traders who bought the cross are forced to sell at a loss, accelerating the downside. The target for this bearish scenario would be a retest of the range lows around 0.00160, effectively erasing the recent gains. This scenario becomes more likely if the broader crypto market faces a macro correction or if Bitcoin shows weakness, dragging high-beta alts like TURBO down with it.
What to Watch Next
To navigate these scenarios, market participants should monitor three specific data points over the coming 24 to 48 hours.
First, watch the reaction at the 0.00190 level. This is the "line in the sand." If price candles wick down to this level and immediately bounce with high volume, it confirms strong demand. If candles close solidly below this level, the bullish structure is compromised.
Second, observe the Volume Oscillator. During any consolidation or pullback, volume should decline. If the price starts dropping and volume increases, it indicates active distribution (selling). If the price drops on low volume, it is likely just a healthy correction.
Third, keep an eye on the RSI on the 4-hour timeframe. The ideal bullish setup is for the price to go sideways while the RSI drops. If the price makes a new high but the RSI makes a lower high (Bearish Divergence), it would be a strong signal to reduce risk exposure.
Risk Note
Cryptocurrency trading involves substantial risk and is not suitable for every investor. The analysis provided here is based on probabilistic patterns and historical market behavior, which do not guarantee future performance. The combination of high volatility, leverage, and speculative news cycles can result in rapid capital loss. Always practice strict risk management and never trade with capital you cannot afford to lose.
The current structure of TURBO offers a compelling case study in the convergence of technical breakout patterns and fundamental utility narratives, but the elevated oscillators demand patience and precision from market participants looking to engage.