The cryptocurrency market is often a battleground between short-term sentiment and long-term fundamental mechanics, and few assets illustrate this friction better than Internet Computer (ICP) as we move into early 2026. Following a turbulent close to 2025, where the asset saw significant volatility, ICP has staged a noteworthy recovery in the opening days of the new year. The price action observed on the 4-hour timeframe suggests a potential shift in market structure, transitioning from a distinct distribution phase into a tentative accumulation or reversal pattern. However, this technical optimism is currently being stress-tested by conflicting narrative drivers, ranging from renewed trading momentum to lingering concerns regarding token supply expansion.
Market Snapshot
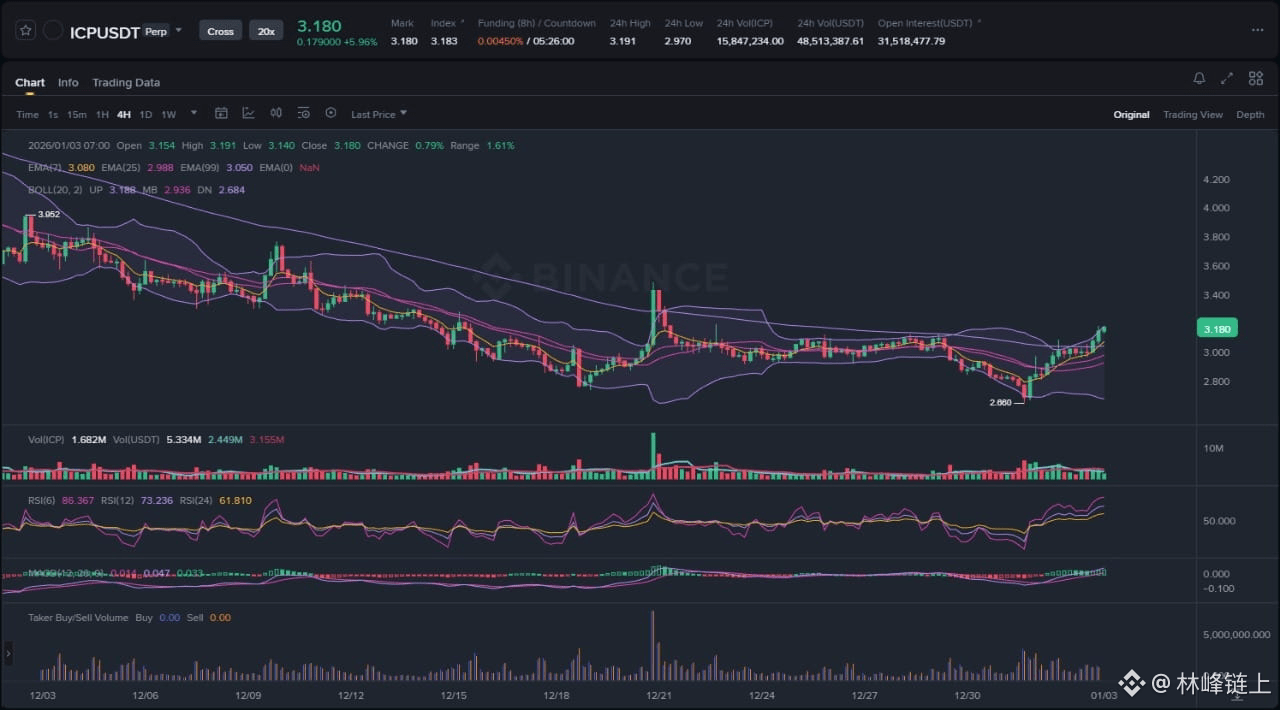
As of January 3, 2026, Internet Computer is trading at approximately $3.18, marking a recovery of nearly 6% in the immediate session and a more significant bounce from the recent swing lows of $2.66 established in late December. The broader market environment appears to be favoring risk-on assets momentarily, allowing altcoins with deep liquidity to retrace losses incurred during the holiday period. For ICP specifically, the reclaim of the $3.00 handle is not merely a technical event but a psychological victory for bulls who have defended this zone aggressively. The market is currently digesting the interplay between oversold technical conditions and the fundamental reality of the protocol's inflation schedule.
Chart Read: Anatomy of a Reversal
Analyzing the attached 4-hour chart provides a granular view of the current market structure. The most dominant feature of the recent price action is the V-shaped recovery initiated from the $2.66 liquidity pocket. Prior to this move, ICP was locked in a persistent downtrend, characterized by a series of lower highs and lower lows, guided downward by the short-term Exponential Moving Averages (EMAs).
The structure began to shift as the calendar turned to 2026. We can observe a "climax sell-off" candle that wicked down to $2.66, which likely cleared out highly leveraged long positions and swept stop-losses sitting below the previous consolidation zones. This maneuver is a classic liquidity grab; once the sell-side liquidity was exhausted, smart money stepped in to absorb the selling pressure, leading to a sharp reversal.
Currently, the price is trading well above the 7-period, 25-period, and notably, the 99-period EMA. The crossover of the shorter-term EMAs above the longer-term 99 EMA is a lagging but confirmatory signal of a trend change on this timeframe. Furthermore, the price action is interacting with the upper Bollinger Band. The bands have expanded significantly, indicating a surge in volatility. The candles are currently "walking the bands," a behavior often seen during strong impulsive moves. However, when price consistently pushes the upper deviation limits, it also increases the probability of a mean reversion snap-back toward the midline (the 20-period moving average), which currently sits near $2.93.
Momentum indicators provide further context. The Relative Strength Index (RSI) on the 6-period setting has pushed into extreme overbought territory, reading above 86, while the standard 12-period RSI is also elevated above 70. While overbought conditions can persist during strong trends, they typically signal that the asset is due for a consolidation or a cooling-off period to allow the indicators to reset. Volume analysis shows a slight uptick on the recovery leg, though it has not yet matched the capitulation volume seen during the drop to $2.66. This divergence suggests that while buyers are in control, the move is driven as much by a lack of sellers at these levels as it is by aggressive new inflows.
News Drivers: Sentiment vs. Tokenomics
The fundamental backdrop for this technical move is shaped by three distinct narratives emerging over the last week. These news items create a push-pull dynamic that traders must navigate.
The first major driver is the positive shift in trading sentiment reported by CoinDesk on January 2, 2026. The headline regarding ICP breaking a "psychological barrier" refers to the reclaim of the $3.00 level. In crypto markets, round numbers often act as substantial mental hurdles for retail traders. Crossing this threshold tends to trigger algorithmic buying and brings sideline capital back into the fray. This news item aligns perfectly with the bullish engulfing candles seen on the chart and serves as validation for the momentum traders entering the market.
Reinforcing this is the second report, also from January 2, noting that ICP "climbs back to $3 as short-term momentum improves." This confirms that the move is not an isolated anomaly but part of a broader increase in activity and interest. The report mentions traders "reassessing near-term direction," implying that the bearish bias that dominated late December is being challenged. This is bullish for price action as it suggests the potential for a short squeeze if bears are forced to cover their positions above $3.20.
However, the third narrative acts as a sobering counterweight. Cryptonews reported on December 30, 2025, that the price crash below $3 was exacerbated by supply expansion concerns. Despite the release of DFINITY's "Caffeine AI," the market initially focused on the inflationary mechanics—specifically that token burn rates have remained low relative to the issuance of new tokens. This is a bearish fundamental factor. When supply expands without a commensurate increase in demand or burn, price appreciation becomes mathematically more difficult. The fact that the price is rallying now suggests the market is temporarily ignoring this supply overhang in favor of a technical bounce, but it remains a structural resistance to a sustained long-term bull run.
Scenario A: Bullish Continuation (The $3.40 Target)
For the bullish case to play out and for this move to evolve from a relief bounce into a sustained trend, ICP must establish the $3.00 - $3.05 zone as a new floor. In this scenario, we would look for the price to consolidate sideways or pull back slightly to test the 99 EMA or the top of the previous resistance structure. A successful defense of this level would confirm that the previous resistance has flipped to support (S/R flip).
If the price holds above $3.05, the next logical target is the liquidity void created during the mid-December sell-off. The chart shows a cluster of trading activity around $3.40 - $3.50. This area represents the next major supply block. Bulls would need to see volume expansion as price approaches $3.25 to push through to $3.50. This scenario assumes that the "psychological barrier" narrative dominates and that the market continues to shrug off the supply concerns mentioned in the negative news cycle. We would essentially be looking for an "ABCD" pattern where the current leg up is followed by a shallow retracement and then a second leg of equal magnitude.
Scenario B: The Bull Trap (Reversion to $2.80)
The alternative scenario considers the possibility that the current move is a "bull trap" or a "dead cat bounce" driven by the RSI reaching unsustainable levels. Given the bearish fundamental news regarding supply expansion, it is plausible that larger players are using this liquidity pump to offload positions at better prices.
In this scenario, we would see a rejection at the current level or slightly higher (around $3.25), followed by a swift drop back below the $3.00 psychological level. If the price closes a 4-hour candle back inside the Bollinger Bands and below the 7-period EMA, it would signal a loss of momentum. A failure to hold $2.93 (the Bollinger Band midline) would be the critical invalidation of the bullish thesis. This would likely trigger a cascade of long liquidations from late buyers, pushing the price back down to retest the demand zone between $2.75 and $2.80. This scenario aligns with the "sell the news" reaction to the recent rally, acknowledging that the fundamental supply issues have not been solved by a few days of green candles.
What to Watch Next
Traders and analysts should focus on three specific data points in the coming 24 to 48 hours to determine which scenario is unfolding.
First, watch the reaction at the Bollinger Band midline ($2.93 - $2.95). In strong trends, price often corrects to the midline and bounces immediately. If price slices through this level with high volume, the trend is likely over.
Second, observe the volume profile on red candles. If the pullbacks are on low volume, it suggests profit-taking rather than structural selling. Conversely, if we see large red volume spikes as price approaches $3.20, it indicates hidden supply and passive sell walls.
Third, monitor the RSI for "hidden bullish divergence." If the price makes a higher low (e.g., at $3.00) while the RSI resets significantly lower, it indicates that the momentum is recharging for another leg up. However, if the RSI remains pegged at overbought levels while price stalls, a sharp correction is often imminent to reset the oscillator.
Risk Note
It is vital to remember that while the chart shows a short-term recovery, the macro trend on the higher timeframes (daily/weekly) may still be developing. The volatility indicated by the widening Bollinger Bands implies that price swings will be violent in both directions. Furthermore, the "supply expansion" narrative is a silent killer; unlike a sudden news event, inflation exerts constant downward pressure that requires constant demand to counteract. Traders should be wary of leverage in this zone, as the $3.00 level is likely to be a site of "stop hunts" in both directions as market makers seek liquidity.
In conclusion, ICP has staged a commendable technical recovery reclaiming the $3.00 mark, but the sustainability of this rally depends entirely on its ability to convert this psychological level into structural support in the face of inflationary tokenomics.