The cryptocurrency market is currently witnessing a rotational shift where capital and attention are beginning to cycle back into utility-driven sectors, with a specific focus on privacy-centric assets. Dash, one of the oldest and most established names in the digital payment and privacy space, has recently exhibited a technical structure that warrants close attention from intermediate and advanced market participants. Following a significant capitulation event in mid-December that saw prices touch a local low of roughly 35.00 USDT, the asset has staged a recovery that combines constructive price action with a shifting fundamental backdrop.
The convergence of on-chain developer metrics, renewed macro narratives regarding financial privacy, and a classic volatility squeeze pattern on the four-hour chart suggests that Dash is approaching a decision point. While broader market sentiment remains cautious, the specific interplay between supply zones and rising demand floors indicates that the asset is transitioning from a markdown phase into a potential accumulation or re-distribution structure. This analysis dissects the technical posture of Dash based on the latest four-hour market data and integrates recent fundamental developments to provide a comprehensive outlook for the coming sessions.
Market Snapshot
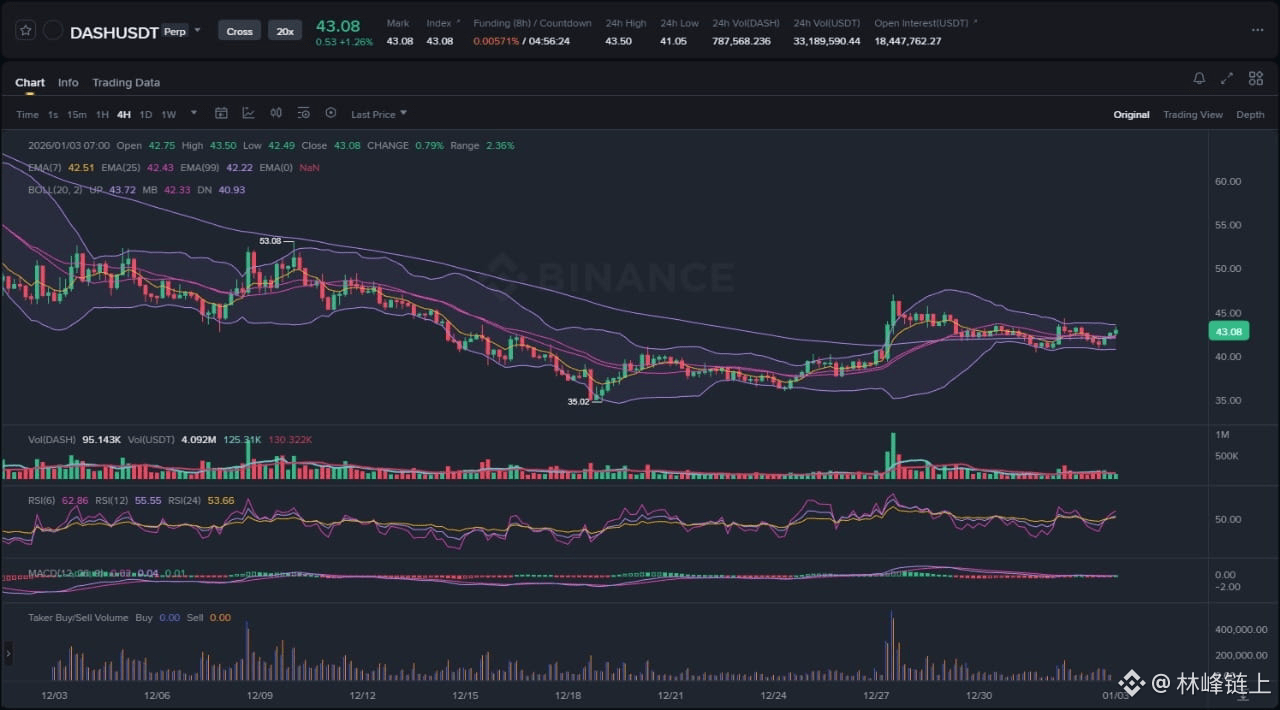
As of the latest data from the attached chart, Dash is trading at approximately 43.08 USDT. The asset has appreciated from a swing low of 35.02 USDT, representing a recovery of over 20 percent in a relatively short timeframe. The current market behavior is characterized by a compression in volatility, as evidenced by the narrowing of the Bollinger Bands and the flattening of the moving averages. This period of consolidation follows an impulsive move upward, creating a technical environment often referred to as a flag or pennant formation. The market is currently weighing the strength of the recovery against overhead resistance levels that were established during the previous downtrend.
Chart Read: Volatility Squeeze and Structural Recovery
The technical landscape for Dash on the four-hour timeframe reveals a distinct shift in market character. For much of early to mid-December, the price action was dominated by a high-momentum bearish trend, characterized by lower highs and lower lows, culminating in the capitulation wick to 35.02 USDT. This level served as a pivotal liquidity grab, where aggressive selling was met with substantial limit buying orders, marking a temporary floor in the market.
Since that inflection point, the price structure has evolved into a recovery phase. The most notable feature on the chart is the behavior of the Bollinger Bands. Following the volatility expansion during the drop and subsequent V-shape recovery, the bands have begun to contract significantly. In technical analysis, periods of low volatility (squeezes) are statistically followed by periods of high volatility (expansions). The price is currently oscillating around the basis line (the middle Bollinger Band), indicating a state of equilibrium between buyers and sellers.
Furthermore, the moving averages provide insight into the short-term trend direction. The 7-period and 25-period Exponential Moving Averages (EMAs) are currently intertwining with the price action, acting as dynamic support. The fact that the price is sustaining levels above these short-term averages suggests that the immediate momentum is neutral-to-bullish. Unlike the steep downtrend observed earlier in the month where price was consistently rejected by these EMAs, the current price action is using them as a shelf to build a potential launchpad.
Volume analysis further corroborates the accumulation thesis. The initial surge from the 35.00 USDT lows was accompanied by a noticeable spike in buying volume, validating the strength of the reversal. During the subsequent consolidation phase—where price has ranged between roughly 40.00 USDT and 44.00 USDT—volume has tapered off. This declining volume during a sideways correction is a textbook signal of a bullish consolidation, implying that selling pressure is exhausted and holders are not distributing their positions at these levels.
News Drivers: Fundamental Strength Meets Macro Narratives
The technical setup is heavily influenced by three key fundamental themes emerging from recent news cycles. These drivers provide the context for the price action and help distinguish between a genuine reversal and a mere dead-cat bounce.
The first and perhaps most significant driver is the surge in developer activity. Data from analytics firm Santiment indicates that the privacy coin sector is undergoing an intense technical upgrade process, with Dash leading the pack in terms of developer activity. High developer activity is a classic leading indicator in the crypto asset class. It demonstrates that despite price volatility, the project's infrastructure is being actively improved and maintained. For investors, this reduces the risk of project abandonment and suggests that the team is preparing for future scalability or feature deployments. This fundamental strength acts as a floor for the price, as it attracts value-investors who prioritize project viability over short-term speculation.
The second driver is the resurgence of the privacy narrative. As Know Your Customer (KYC) policies tighten globally and surveillance concerns mount, the utility proposition of privacy-focused assets is being re-evaluated. Comments from Dash core members have highlighted this shift, noting that the demand for financial privacy is returning to the forefront of the crypto ethos. This macro-environmental shift provides a tailwind for Dash. When the broader market narrative shifts toward censorship resistance and privacy, legacy assets in this sector often experience capital inflows as traders hedge against regulatory overreach. This thematic driver supports the bullish case for a breakout.
However, the third driver introduces a necessary note of caution. Market analysis from AMBCrypto points out that despite strong weekend gains, buyers must remain wary of the liquidity pocket around 53.00 USDT. The analysis suggests that while Dash is likely to gravitate toward this level due to the mechanics of price magnets, a breakout past this supply zone is not imminent without a significant catalyst. This aligns perfectly with the technical resistance visible on the chart at the previous swing high. It implies that while the path of least resistance may be upward, it will likely be a grind involving profit-taking at key levels rather than a parabolic ascent.
Scenario A: Bullish Continuation and Liquidity Hunt (Primary Bias)
The primary scenario focuses on the resolution of the current volatility squeeze to the upside, driven by the strong developer metrics and the accumulation pattern visible on the chart. For this scenario to materialize, the price must first decisively reclaim the 44.50 USDT level, which represents the immediate local resistance and the upper boundary of the current consolidation range.
In this scenario, a 4-hour candle close above the upper Bollinger Band would signal the start of a volatility expansion phase. This breakout would likely attract momentum traders and algorithmic systems triggered by the breach of the range high. The immediate target for this move would be the 53.00 USDT level. This level is critical because it represents a previous swing high and a known liquidity pocket. In trading theory, price often seeks liquidity; therefore, the resting sell orders and stop-losses located around 53.00 USDT act as a magnet pulling the price upward.
Traders should look for the Relative Strength Index (RSI) to push into overbought territory (above 70) during this move, but without forming a bearish divergence. A strong RSI coupled with expanding volume would confirm the validity of the breakout. If the price reaches the 53.00 USDT region, a reaction is expected. It is unlikely to slice through this level on the first attempt; rather, a test of 53.00 USDT followed by a shallow pullback would constitute healthy market structure. This scenario assumes that the broader crypto market remains stable and that Bitcoin does not experience a sudden liquidation event.
Scenario B: Invalidation and Range Breakdown (Alternative Bias)
The alternative scenario considers the possibility that the current consolidation is a redistribution phase rather than accumulation. This bearish outlook would be triggered if the broader market weakness drags privacy coins down or if the resistance at the moving averages proves too strong.
The invalidation level for the bullish thesis is the 40.00 USDT support zone. This area has acted as the floor of the current "flag" structure. A high-volume 4-hour candle close below 40.00 USDT would indicate that the demand absorbed during the recovery has been exhausted. Such a breakdown would technically confirm a "bear flag," suggesting that the prior downtrend is resuming.
If 40.00 USDT is lost, the price would likely drift lower to retest the capitulation wick at 35.02 USDT. This retest is dangerous; if the 35.00 USDT level fails to hold, price discovery to the downside would begin, potentially targeting historical support levels much lower. This scenario would likely be accompanied by a widening of the Bollinger Bands to the downside and the RSI dropping below 40 into bearish control zones. It is important to note that the "neutral" news regarding the difficulty of breaking 53.00 USDT supports the idea that upside is capped, but it does not necessarily predict a crash unless the 40.00 USDT floor is breached.
What to Watch Next
To navigate the coming volatility, market participants should focus on three specific actionable signals over the next 24 to 72 hours.
First, observe the volume profile on any move outside the 42.00 - 44.00 USDT range. A genuine breakout requires volume expansion. If price moves up but volume decreases, it is likely a "fakeout" designed to trap longs before a reversal. Conversely, if price drops on low volume, it may simply be a stop-hunt into support before the real move up.
Second, watch the interaction with the 99-period EMA (purple line on the chart). This longer-term moving average often acts as a trend filter. Currently sitting above the price, it represents the dynamic resistance that the bulls must conquer. A successful flip of the 99 EMA into support would be a major signal of a medium-term trend reversal.
Third, monitor the Bollinger Band Width. As the bands tighten further, the potential energy for a move increases. Do not anticipate the direction solely based on the squeeze; wait for the first impulsive candle that closes outside the bands to dictate the direction of the trade.
Risk Note
While the combination of high developer activity and a privacy-centric narrative offers a compelling bullish thesis, the crypto market remains highly correlated. A downturn in major assets like Bitcoin or Ethereum can invalidate individual chart patterns regardless of their quality. Furthermore, the 53.00 USDT level is a significant supply zone; expecting a clean break above it without a struggle is optimistic. Traders should manage risk by utilizing stop-losses below the invalidation point of 40.00 USDT and avoiding over-leverage during periods of volatility contraction.
In conclusion, Dash is presenting a classic technical setup supported by improving fundamentals. The market is coiling, and the direction of the next expansion will likely dictate the trend for the coming weeks. Whether the price seeks the liquidity at 53.00 USDT or retests the lows depends on the bulls' ability to defend the 40.00 USDT floor and reclaim the mid-range moving averages.