As the crypto markets navigate the opening days of 2026, Bitcoin finds itself at a pivotal juncture that has captured the attention of institutional analysts and retail traders alike. Following a volatile 2025 that saw prices reach dizzying all-time highs of approximately 126,000 USD, the subsequent correction has brought the asset back to a zone of intense negotiation. Currently trading near 90,225 USD, Bitcoin is engaging in a complex structural battle between lingering bearish macro sentiment and constructive short-term technical formations. The psychological weight of the 90,000 USD level cannot be overstated, as it serves as the threshold between a potential reclamation of the bull trend and a descent into the deeper bearish targets touted by fearful headlines.
Market Snapshot
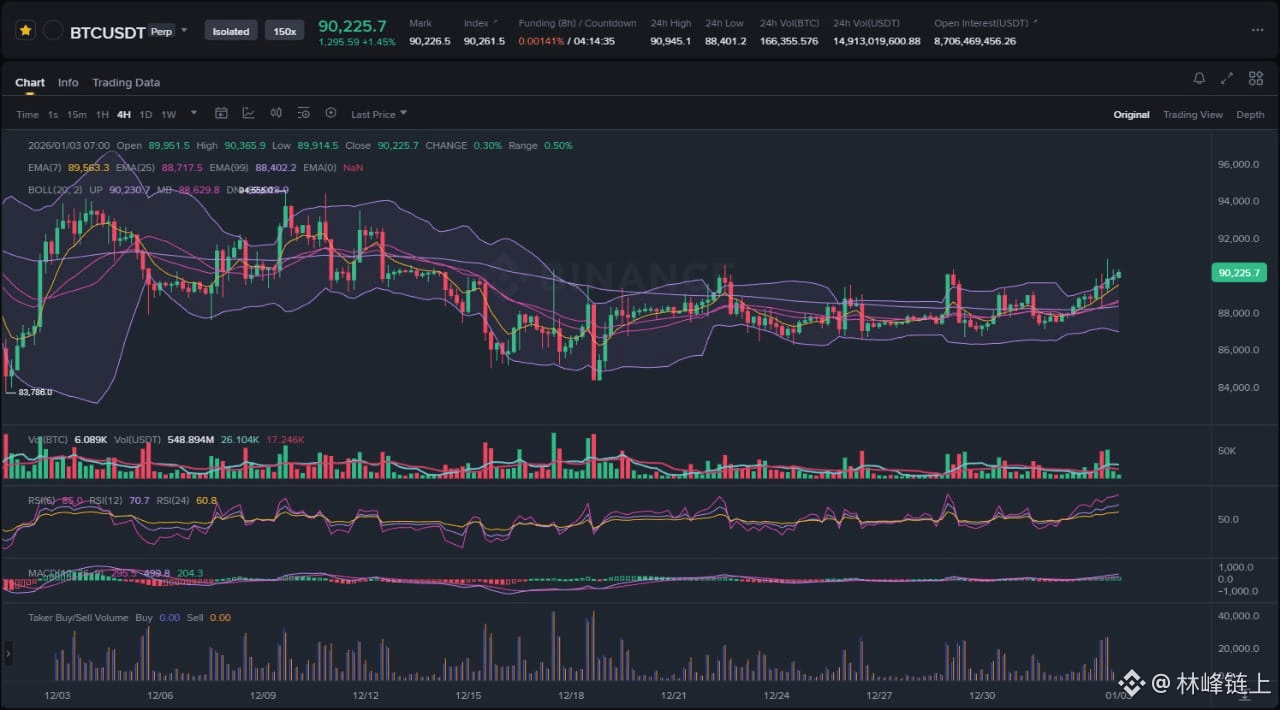
The attached 4-hour chart for the BTC/USDT Perpetual contract illustrates a market in transition. After a period of downward pressure and consolidation throughout mid-to-late December, price action has begun to coil and push upward. The asset is currently trading at 90,225.7 USD, marking a modest but significant recovery from the local lows established in the 84,000 USD to 85,000 USD region. The immediate market structure suggests a shift from distribution to a tentative accumulation phase, characterized by higher lows and a compression of volatility that is now beginning to expand. This price action is occurring against a backdrop of mixed signals, where on-chain metrics and technical indicators are signaling strength, while broader market sentiment remains cautious due to historical cycle concerns.
Chart Read: Technical Structure and Indicator Analysis
A granular analysis of the provided 4-hour chart reveals several key technical developments that favor a cautiously bullish bias in the short term, despite the overarching corrective trend from the 2025 highs.
First, the price structure shows a clear rounding bottom or "saucer" formation developing since mid-December. The impulsive drop to the 84,000 USD region was met with a swift rejection, indicating strong demand liquidity in that lower zone. Since then, the market has established a series of higher lows, gradually grinding through the 88,000 USD resistance, which has now flipped into a support zone.
The Bollinger Bands (20, 2) offer a compelling narrative of volatility expansion. Throughout late December, the bands tightened significantly, indicating a "squeeze" or a period of low volatility. In technical analysis, such squeezes are typically precursors to violent moves. Currently, the price is riding the Upper Bollinger Band, pushing it upwards. This "band walking" behavior is a hallmark of strong momentum. As long as the 4-hour candles continue to close near or above the upper band, the immediate trend remains upward.
Exponential Moving Averages (EMAs) provide further confirmation of this short-term bullish reversal. The chart displays the 7, 25, and 99 EMAs. The price has successfully reclaimed the 99 EMA (purple line), which had acted as dynamic resistance during the mid-December downtrend. Furthermore, we are witnessing a bullish fanning of the shorter-term EMAs (7 and 25) above the longer-term 99 EMA. This alignment suggests that the path of least resistance has shifted to the upside.
Momentum indicators also support the bullish thesis. The MACD (Moving Average Convergence Divergence) shows a crossover above the zero line, with the histogram expanding in positive territory. This indicates that buying pressure is accelerating. Similarly, the RSI (Relative Strength Index) is hovering in the 60-70 range. This is a "sweet spot" for bulls; it indicates strength without being critically overbought, suggesting there is still room for price appreciation before a technical pullback is necessitated.
However, volume analysis presents a slight concern. While price is rising, the volume bars at the bottom of the chart do not show a massive expansion comparable to the initial drop in early December. This divergence—price rising on moderate volume—suggests that the move is currently driven by a lack of selling pressure rather than an influx of aggressive new buying. For this rally to sustain, we need to see a volume spike confirming the breakout above 90,000 USD.
News Drivers: Sentiment vs. Reality
Integrating the latest news digest with the technical picture reveals a classic "Wall of Worry" scenario.
Theme 1: The Battle for Structural Support
The first major theme is the defense of long-term trend lines. News reports highlight that Bitcoin is beginning 2026 near 90,000 USD, with critical support identified at the 20-month moving average, approximately 88,049 USD. This news item aligns perfectly with the technical support visible on the chart. The consolidation zone just below current prices represents this defense. The fact that bulls have successfully held the 88,000 USD level is a major victory. It suggests that despite the 30 percent correction from the all-time highs of 126,199 USD, the macro uptrend remains technically intact as long as this monthly level holds.
Theme 2: Bearish Capitulation Narratives
Conversely, bearish sentiment is rampant. Reports from NewsBTC highlight the formation of a "death cross" and technical indicators pointing to an imminent drop to 38,000 USD. This represents the extreme bearish view. In trading psychology, when mainstream headlines call for catastrophic drops (like 38k) while price action is actually grinding up (reclaiming 90k), it often signals a local bottom. The market has a tendency to punish the majority consensus. If late shorters are piling in expecting a crash to 38,000 USD, the current move above 90,000 USD could trigger a short squeeze, fueling the rally further.
Theme 3: Altcoin Weakness and BTC Dominance
The third theme involves the struggle of the wider crypto market. Reports indicate that 2021 was likely the last "true" alt season and that altcoins are currently trapped by funding spikes and leverage. This is bullish for Bitcoin dominance. In uncertain times, liquidity flows from riskier assets (altcoins) back to the safety of the market leader (Bitcoin). If altcoin traders are capitulating, that capital is likely rotating into BTC, providing the bid support needed to maintain the 90,000 USD level.
Scenario A: Bullish Continuation (Primary Bias)
The primary scenario relies on the continuation of the current momentum and the validation of the Bollinger Band breakout.
For this scenario to play out, Bitcoin must establish a daily close firmly above the 90,500 USD to 91,000 USD region. This would confirm that the breakout from the December consolidation is genuine and not a "bull trap."
In this event, the immediate target is the liquidity pocket around the early December highs, likely in the 93,500 USD to 94,000 USD range. A move to this level would likely trigger stops on short positions opened during the late December chop. The mechanism driving this move would be a "short squeeze" combined with momentum chasing. As the price rides the Upper Bollinger Band, we would expect the 7 EMA to act as a dynamic trendline. As long as price does not close below the 7 EMA on the 4-hour chart, the aggressive long trade remains active.
Scenario B: Bearish Rejection and Breakdown (Alternative)
The alternative scenario considers the validity of the bearish news cycle and the potential for a "fakeout."
If Bitcoin fails to hold the 90,000 USD level and slips back below the 99 EMA (currently around 88,400 USD), the bullish thesis is invalidated. This would indicate that the move above 90,000 USD was merely a liquidity grab to trap breakout traders before a continuation of the downtrend.
The critical trigger for this scenario would be a high-volume rejection candle leaving a long upper wick, followed by a close back inside the Bollinger Bands. If the price loses the 88,000 USD support (the 20-month MA mentioned in the news), the market would likely accelerate downward to test the mid-December lows at 84,000 USD. A loss of 84,000 USD would open the door to the bearish macro targets, validating the fears of a deeper correction, though the extreme 38,000 USD target remains a distant probability in the immediate timeframe.
What to Watch Next
Traders should monitor three specific data points over the next 24 to 48 hours to determine which scenario is playing out.
First, watch the Volume Profile. We need to see volume expansion. If the price pushes higher to 91,000 USD but volume continues to decline, be wary of a divergence that often precedes a sharp reversal.
Second, observe the reaction at the 88,000 USD level. This is now the "line in the sand." As long as price stays above this, the bears are on the back foot. A clean retest and bounce from 88,000 USD would be a classic bullish entry signal.
Third, keep an eye on the RSI. If the price makes a new high but the RSI fails to make a higher high (bearish divergence), it would suggest that the momentum is waning and a pullback is imminent.
Risk Note
It is crucial to remember that the market is currently in a state of high leverage. The news mentions funding spikes, which indicates that traders are heavily positioned. This environment often leads to "leverage flushes" where price wicks violently in both directions to liquidate over-leveraged participants before choosing a true direction. Avoid high-leverage positions in the middle of the trading range; wait for confirmed breakouts or retests of key levels.
In conclusion, while the macro headlines scream caution, the price action whispers continuation, suggesting that the path of least resistance for Bitcoin is currently to the upside, provided the 88,000 USD fortress remains breached.