The cryptocurrency market is often defined by its paradoxes, and the current price action surrounding XRP serves as a textbook example of market dislocation followed by aggressive mean reversion. As we navigate the early days of 2026, XRP has presented traders and analysts with a complex narrative that blends deteriorating social sentiment with high-velocity bullish price action. The asset has recently staged a significant reversal, challenging the prevailing bearish bias that dominated the end of the previous year. This analysis dissects the technical posture of XRP based on the latest 4-hour market data, juxtaposed against a backdrop of extreme investor fear and significant shifts in the asset's market capitalization rankings. We will explore whether this move represents a genuine structural recovery or a volatility-induced liquidity grab in a wider distribution phase.
Market Snapshot
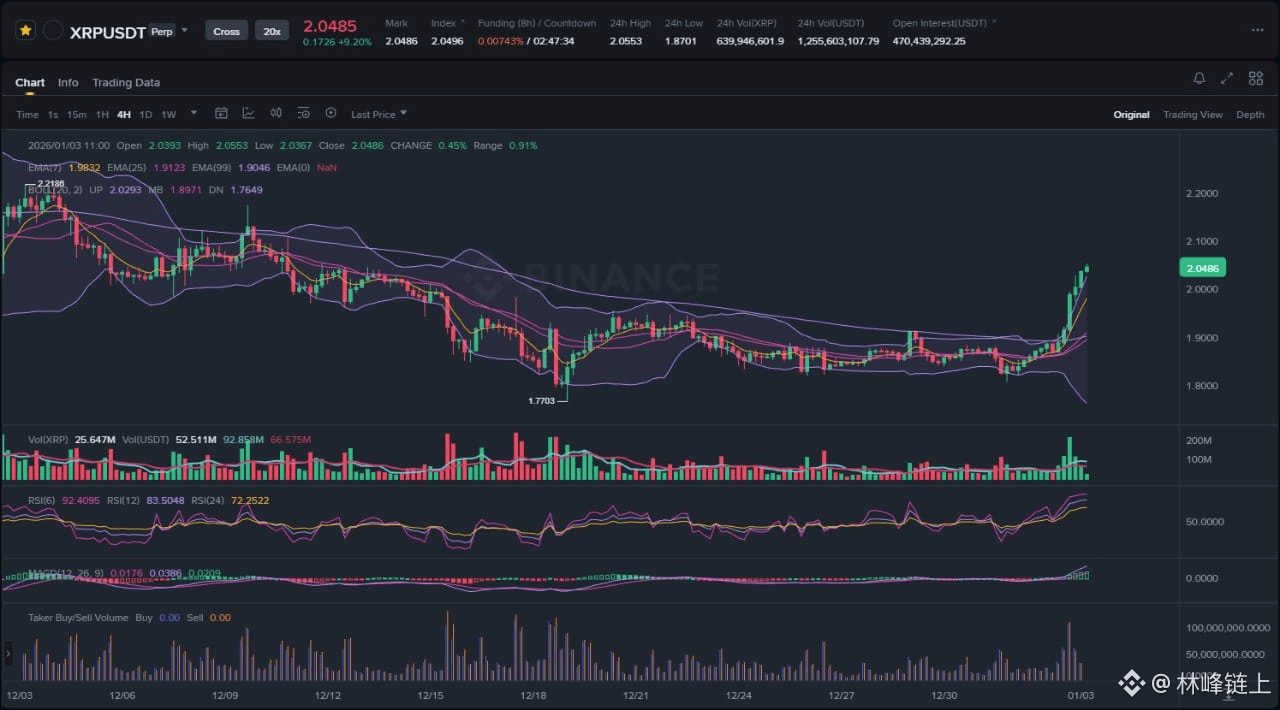
At the time of writing, XRP is trading in the vicinity of 2.0485 USDT, marking a substantial recovery from its recent swing lows. The market is currently digesting a high-momentum impulse that has seen the asset appreciate significantly within a short 24-hour window. This move has not only altered the immediate technical landscape but has also had profound implications for the broader altcoin hierarchy, specifically regarding XRP's market cap relationship with BNB. The environment is characterized by high volatility, as evidenced by the expansion of volatility bands and increased trading volume. While the broader market sentiment remains cautious, XRP has decoupled from the general stagnation to lead a sector-specific rally. This divergence between price action and sentiment—where price rises while fear is at its peak—often signals a capitulation bottom, where weak hands have been flushed out, allowing smart money to accumulate at discounted valuations.
Chart Read: Technical Structure and Price Action Analysis
The attached 4-hour chart provides a granular view of the recent market structure shift. The most immediate observation is the transition from a prolonged downtrend into a violent bullish breakout.
Trend Structure and Breakout Dynamics
For the majority of the visible timeframe, XRP was locked in a clear bearish structure, characterized by lower highs and lower lows. The price action respected a descending channel, consistently finding rejection at the dynamic resistance offered by the short-term Exponential Moving Averages (EMAs). The local bottom was established at 1.7703, a level that served as a pivot point for liquidity. Following this low, the market entered a brief period of consolidation, forming a base between 1.80 and 1.90. This compression phase was critical, as it allowed momentum indicators to reset and selling pressure to exhaust.
The breakout from this consolidation has been impulsive. The current candle structure shows a series of large, bullish marubozu-style candles that have pierced through the EMA ribbon and the upper Bollinger Band. This indicates a "volatility expansion" phase. The price has successfully reclaimed the psychological 2.00 level, a zone that previously acted as resistance. This structural break of the previous lower-high sequence suggests a potential change in character (ChoCH) for the asset, shifting the short-term bias from bearish to bullish.
Indicator Analysis
The Bollinger Bands on the chart tell a compelling story of volatility compression followed by expansion. Prior to the breakout, the bands had narrowed significantly, indicating a "squeeze." The subsequent price explosion has forced the upper band to expand upward, confirming the strength of the move. However, the price is currently riding the upper band, a state that is statistically unsustainable for long periods without a reversion to the mean or a period of sideways consolidation to allow the bands to catch up.
The Relative Strength Index (RSI) is currently printing values deep in the overbought territory (above 70, and appearing to approach 80-90 based on the purple oscillator line). While traditional analysis might interpret this as a sell signal, in strong trending markets, an "embedded" overbought RSI can signify immense momentum rather than an immediate reversal. However, it does warrant caution, as the asset is mathematically overextended relative to its recent average price.
Volume Profile
Volume analysis confirms the validity of the move. The breakout was accompanied by a noticeable spike in buying volume, visible on the histogram. This suggests that the move is backed by genuine market participation and capital inflow, rather than being a "ghost move" driven solely by thin order books. The volume expansion validates the breakout of the 1.90 resistance zone.
News Drivers: Sentiment vs. Reality
The technical breakout must be contextualized within the current fundamental and sentiment-based news cycle. A review of the latest headlines reveals a trifecta of conflicting signals that creates a unique trading environment.
Theme 1: Contrarian Sentiment and Capitulation
The headline regarding "Strong Social Discontent" and "Extreme Fear" is perhaps the most significant non-price indicator. The report that investor sentiment had plummeted to extreme lows just as 2026 began aligns perfectly with the technical bottom formed at 1.7703. In financial markets, peak fear often coincides with local bottoms because it marks the point where the last marginal seller has exited the market. When the crowd is unanimously bearish, the market runs out of supply, and even a small amount of buying pressure can trigger a sharp reversal. The current rally is likely a "disbelief rally," fueled by the closing of short positions (short squeeze) from traders who were betting on a breakdown below the "danger zone."
Theme 2: Structural Integrity and Support Defense
The news item mentioning XRP entering a "Danger Zone" after breaking 400-day support highlights the severity of the prior downtrend. The breakdown below long-term support was a technical failure that likely triggered stop-losses for swing traders. However, the subsequent rapid recovery back above these levels is a classic "bear trap" or "deviation" pattern. When a market breaks a major support level but quickly reclaims it, it suggests that the breakdown was a liquidity hunt rather than a genuine shift in value. The ability of XRP to negate this bearish breakdown is a strong signal of underlying demand.
Theme 3: Market Dominance and Capital Rotation
The report that XRP has overtaken BNB to become the fourth-largest cryptocurrency is a major catalyst for momentum. This "flippening" is not just symbolic; it impacts algorithmic trading strategies and portfolio rebalancing for index funds. An 8% surge in 24 hours that results in a ranking shift draws significant attention to the asset, creating a feedback loop of fear of missing out (FOMO). This fundamental shift in market hierarchy supports the bullish case, as it implies relative strength compared to the broader altcoin market.
Scenario A: Bullish Continuation and Acceptance (Primary)
In this scenario, we assume the breakout is a genuine change in trend direction and not merely a corrective bounce within a larger downtrend. For the bullish case to sustain, the market must prove that it can accept higher prices without immediate rejection.
The path forward involves a "flagging" or consolidation structure. Given the overextended RSI, a vertical continuation is less likely than a period of sideways movement. Bulls need to see the price hold above the 1.95 - 1.98 region. This area, previously a zone of resistance and consolidation, must now flip to support (S/R Flip). If the price can consolidate here, allowing the 4-hour EMAs to catch up to the price action, it would create a healthy base for the next leg up.
The target for this continuation would be the liquidity pockets residing above the 2.15 and 2.20 levels. A successful defense of the 2.00 psychological level would act as a confirmation signal. Traders should look for declining volume during any pullbacks (indicating a lack of aggressive selling) and increasing volume on attempts to push higher. This scenario relies on the "Social Discontent" transforming into "Hope" and eventually "Greed" as the price reclaims lost territory.
Scenario B: The Bull Trap and Mean Reversion (Alternative)
The alternative scenario considers the possibility that this move is a "Swing Failure Pattern" (SFP) or a "Dead Cat Bounce" on a macro scale. Despite the strong momentum, the macro trend prior to this week was bearish.
In this invalidation scenario, the rapid surge to 2.05 represents a run on liquidity to fill short orders before a continuation of the downtrend. The key signal for this bearish outcome would be a failure to hold the breakout level. If price action swiftly reverses and closes back inside the previous consolidation range (below 1.90), it would confirm that the breakout was a "fakeout."
Technically, this would manifest as a "shooting star" or "engulfing bearish" candle formation on the 4-hour or daily chart, coinciding with the RSI turning down sharply from the overbought zone. If the price falls back below the EMA ribbon (currently rising around 1.90-1.92), it would indicate that the surge was purely driven by short-covering rather than new spot buying. The target in this scenario would be a retest of the 1.77 lows, as the market seeks to finish the "danger zone" breakdown that was momentarily interrupted.
What to Watch Next
For market participants monitoring XRP in the coming sessions, three specific metrics and behaviors should be prioritized:
1. Reaction at the 2.00 Psychological Level: Watch the order book depth and time-and-sales data around the 2.00 handle. Does the price bounce cleanly off this level during intraday dips? A clean retest and bounce confirms the level has flipped to support. A slice through it with high volume suggests weakness.
2. Volume on Pullbacks: As the price inevitably corrects to cool off the RSI, observe the volume. Healthy bullish corrections have low volume. If red candles appear with volume bars higher than the current green breakout bars, it indicates that whales are using this liquidity to offload positions (distribution).
3. RSI Reset: Watch for the RSI to cool down from 80+ to the 50-60 range. If the price can maintain a value above 1.95 while the RSI resets, it indicates hidden bullish divergence and strength. If the RSI drop drags the price down linearly, the trend is fragile.
Risk Note
While the momentum is currently favoring the bulls, traders must acknowledge the high-risk nature of chasing a vertical move. The asset is currently far extended from its mean (the moving averages), increasing the probability of a snap-back or "mean reversion" event. Furthermore, the news cycle indicates that this rally is occurring against a backdrop of long-term support damage; structural repairs take time, and volatility is likely to remain elevated. Positions taken at these levels carry the risk of drawdown if the market decides to retest the breakout point.
Closing
XRP has staged an impressive technical rebellion against a bearish macro sentiment, but the sustainability of this reversal hinges entirely on the market's ability to defend the 2.00 USDT level and transform extreme fear into sustained accumulation.