The cryptocurrency market is a theater of extreme volatility, and few assets have exemplified this characteristic as vividly in recent weeks as PIPPIN. Following a period of intense speculative fervor that saw prices wick aggressively toward record highs, the asset has entered a complex corrective phase that demands careful dissection. The current market structure presents a classic study in market psychology, leverage unwinding, and the search for equilibrium after a parabolic event. As traders and investors navigate the aftermath of the late December volatility, the price action on the 4-hour chart offers distinct clues regarding the next likely directional move. We are currently witnessing a battle between structural bearish pressure and the potential for a mean-reversion bounce, making this a pivotal moment for market participants monitoring the asset.
Market Snapshot:
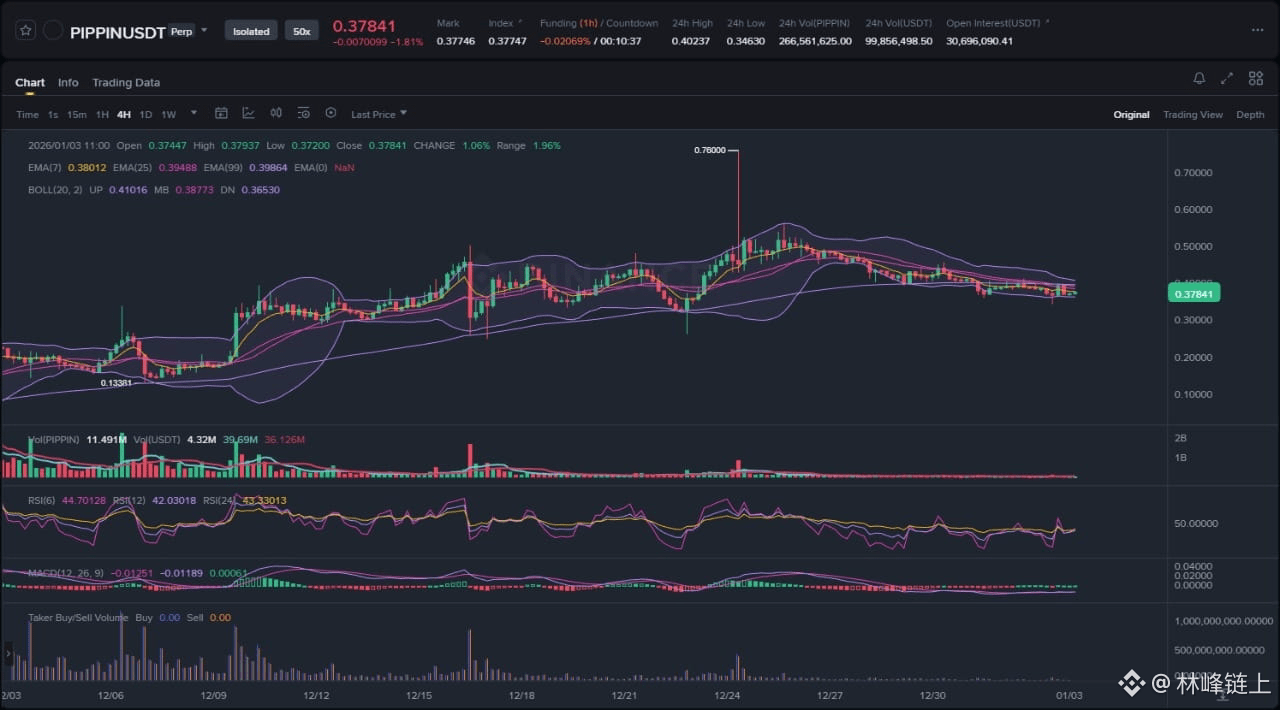
At the time of this analysis, PIPPIN is trading in the vicinity of 0.3784, a significant retracement from its local peak of 0.7800 achieved during the highly volatile session visible on the chart. The market capitalization and trading volume have compressed significantly compared to the impulsive moves seen in late December. The price action is currently encapsulated within a tightening range, often referred to by technical analysts as a period of volatility contraction. The immediate market sentiment appears cautious, with the euphoria of the previous rally having dissipated, replaced by a methodical grind lower. The 24-hour change indicates a minor decline, suggesting that while the aggressive selling pressure has abated, demand has not yet returned with sufficient force to reverse the trend. The funding rates and open interest data visible on the dashboard suggest a cooling of the overheated leverage that characterized the previous surge.
Chart Read:
Technically, the 4-hour chart reveals a distinct shift in market structure from a bullish impulsive phase to a corrective distribution or accumulation phase. The most dominant feature on the chart is the long upper wick hitting the 0.7800 level, which marks a classic "blow-off top" scenario. This pattern typically indicates a liquidity grab where late buyers were trapped, and smart money utilized the liquidity to exit large positions. Since that peak, the price has established a series of lower highs and lower lows, confirming a local downtrend.
Currently, the price is trading below the key Exponential Moving Averages (EMAs). The 7-period, 25-period, and 99-period EMAs are fanned out in a bearish alignment, providing dynamic resistance overhead. Specifically, the 25 EMA (pink line) and the 99 EMA (purple line) are acting as a ceiling, suppressing any minor relief rallies. This alignment confirms that bears are currently in control of the immediate trend.
Furthermore, the Bollinger Bands are exhibiting a "squeeze" formation. The bands have narrowed significantly compared to the expansion seen during the rally. A squeeze of this nature invariably precedes a significant volatility expansion, though it does not predict the direction. The price is currently hugging the lower band and struggling to reclaim the midline (basis), which is a sign of weakness.
Volume analysis provides additional context. The volume bars at the bottom of the chart show a declining profile. The massive spikes associated with the rally to 0.7800 have been replaced by low, flat volume. In technical analysis, falling volume during a correction can be interpreted in two ways: either sellers are becoming exhausted, or buyers are completely absent. Given the slow bleed in price, it suggests a lack of aggressive bidding rather than aggressive selling.
The Relative Strength Index (RSI) is hovering in the low 40s. It is not yet in oversold territory (below 30), which implies there is still room for further downside before a technical bounce becomes statistically probable. The MACD (Moving Average Convergence Divergence) is showing a flat to slightly bearish histogram, with the signal lines submerged below the zero line, reinforcing the lack of bullish momentum.
News Drivers:
To understand the current technical setup, one must contextualize it within the recent fundamental narrative. The news cycle surrounding PIPPIN has been dominated by three distinct themes that explain the volatility seen on the chart.
The first theme is the "Short Squeeze" narrative. Reports from late December highlighted that the aggressive price surge was fueled by traders attempting to short PIPPIN. As noted in market coverage, the price appreciation was partially a mechanical reaction to short liquidations. When a crowded short trade is unwound, buy orders are triggered automatically, forcing the price vertically higher. This explains the rapid wick to 0.7800. However, once the short squeeze ran its course and the "fuel" of liquidations was exhausted, the natural buying pressure was insufficient to sustain those levels, leading to the current correction.
The second theme revolves around "Institutional Flows and Divergence." While price was nearing record levels, data providers noted that outflows were starting to rise. This is a critical divergence often seen at market tops: price makes a new high, but money flow turns negative. This news item aligns perfectly with the chart's rejection at 0.7800. It suggests that while retail traders were chasing the momentum, larger holders were distributing their tokens, creating the supply overhang that is currently weighing on the price.
The third theme is "Leverage and Volatility." The surge of 32% mentioned in reports was accompanied by rising leverage. High leverage environments are inherently unstable. The subsequent bleed-off in price is the market's way of flushing out this excess leverage. The elevated volatility mentioned in the news has now transitioned into the low-volatility compression we see today. This transition from high-leverage chaos to low-leverage stagnation is a healthy, albeit painful, part of the market cycle, necessary to build a base for the next move.
Scenario A (Primary):
For a bullish reversal or continuation of the macro uptrend to occur, PIPPIN must first stabilize and reclaim specific structural levels. The primary scenario for a bullish case involves a "reclaim and hold" of the 0.4000 psychological level, which roughly coincides with the middle Bollinger Band and the short-term EMAs.
In this scenario, we would need to see a high-volume impulse candle close above the 25-period EMA. This would signal that the immediate selling pressure has been absorbed. If the price can establish support above 0.4000, the next logical target would be the 0.4800 - 0.5000 region, where the 99-period EMA and previous structural resistance reside. A break above this zone would invalidate the local bearish trend and could open the door for a retest of the 0.6000 liquidity pockets.
This scenario relies on the assumption that the current low-volume bleed is a form of accumulation. If the "smart money" that sold the top is now re-accumulating in this 0.3500-0.3700 range, we should see a sudden expansion in volume followed by a sharp move upward. Traders looking for this scenario should watch for "bullish divergence" on the RSI, where price makes a lower low but the RSI makes a higher low, signaling waning bearish momentum.
Scenario B (Alternative):
The alternative, and currently statistically favored scenario based on the trend, is a bearish breakdown or "capitulation." Since the price is trading below all key moving averages and making lower lows, the path of least resistance remains down.
In this scenario, the support zone around 0.3500 fails to hold. A breakdown below the recent consolidation low would likely trigger a cascade of stop-losses from traders who bought the dip. This liquidity event would push the price rapidly lower, seeking the next major demand zone. Looking at the left side of the chart, there is a significant volume gap or "imbalance" created during the initial rally in early December. Markets often seek to fill these inefficiencies.
A breakdown below 0.3500 could see PIPPIN retrace toward the 0.2800 - 0.3000 region. This would represent a full mean reversion of the December rally. This scenario would be confirmed if the Bollinger Bands expand downwards and volume spikes on a red candle, indicating panic selling. This "flush" is often the final stage of a correction before a sustainable bottom is found.
What to Watch Next:
Traders and analysts should monitor three specific data points in the coming sessions to determine which scenario is playing out.
First, observe the Volume profile on the 4-hour timeframe. A move without volume is likely a fake-out. A genuine reversal requires a volume spike significantly higher than the average of the last 20 bars. If price moves up on low volume, it is likely a "dead cat bounce" destined to be sold into.
Second, watch the reaction at the 20-day Moving Average (the center line of the Bollinger Bands). Currently, this line is sloping downwards. Until the price can close a 4-hour candle above this line and turn it flat or upward, the trend remains bearish.
Third, monitor Open Interest (OI) if available. If price drops but Open Interest rises, it suggests aggressive shorting is returning, which could set up another short squeeze (bullish). Conversely, if price drops and Open Interest drops, it indicates longs are capitulating (bearish continuation).
Risk Note:
Trading assets like PIPPIN involves substantial risk due to their historical volatility and susceptibility to leverage-driven moves. The presence of a "blow-off top" on the chart indicates that the market is in a delicate state of repair. Support levels in crypto are not concrete floors but rather zones of probability. A break of support can lead to rapid depreciation. Furthermore, the reliance on news narratives regarding short squeezes implies that much of the price action is driven by speculation rather than fundamental utility, increasing the risk of sudden reversals. Always employ strict risk management strategies, such as stop-losses and position sizing, when engaging with high-beta assets.
In conclusion, PIPPIN is at a structural crossroads, compressing within a downtrend after a major volatility event. While the potential for a recovery exists upon reclaiming the 0.4000 level, the prevailing technicals favor caution until a definitive breakout or breakdown from the current Bollinger squeeze occurs.