The crypto market landscape often rewards assets that demonstrate a convergence of constructive technical structure and forward-looking fundamental narratives. SUI has recently emerged as a focal point of interest for market participants, driven by a decisive shift in price action and significant updates regarding its long-term development roadmap. The asset is currently navigating a volatility expansion phase following a prolonged period of consolidation, suggesting a potential change in the intermediate trend. This analysis dissects the interplay between the technical breakout visible on the 4-hour chart and the fundamental catalyst provided by Mysten Labs regarding future private transaction capabilities. By examining liquidity flows, momentum indicators, and the implications of regulatory-compliant privacy features, we can construct a probabilistic framework for SUI's trajectory in the coming weeks.
Market Snapshot
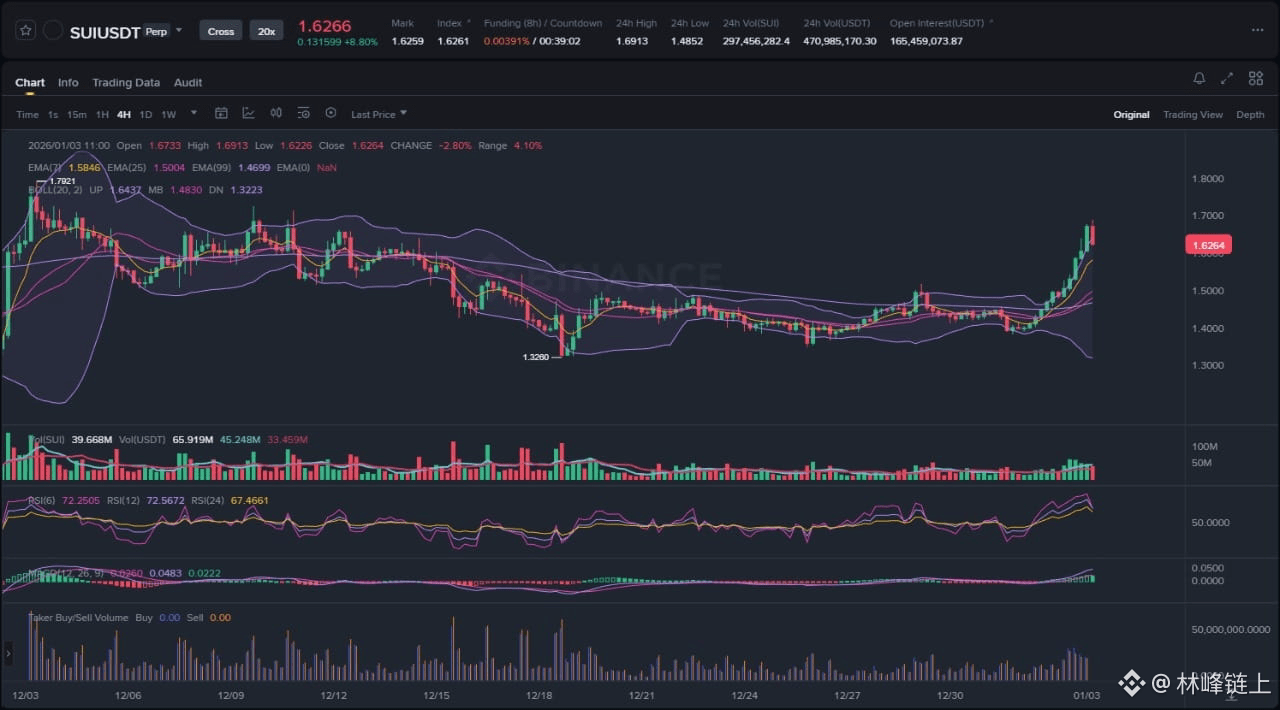
At the time of this analysis, SUI is trading near the 1.6266 mark, representing a significant recovery from recent lows. The market structure has shifted from a defensive, range-bound posture to an aggressive expansion phase. The 4-hour chart captures a classic transition from low volatility to high volatility, a hallmark of trend initiation. The price action is currently challenging overhead supply zones, with the immediate focus on sustaining the momentum generated over the last 48 hours. The broader market context remains essential, but SUI is displaying relative strength, decoupling from the lethargy seen in some legacy altcoins. The current valuation reflects a market that is pricing in both short-term speculative demand and long-term utility value, specifically tethered to the protocol's scalability and upcoming feature set.
Chart Read
A granular examination of the attached 4-hour chart reveals several critical technical developments that define the current market bias. The most prominent feature is the completion of a rounding bottom structure, often referred to as a saucer formation, which originated from the swing low of 1.3260 established in mid-December. This structure is significant because it indicates a gradual transfer of inventory from weak hands to strong hands, characterized by a decrease in selling pressure and a progressive increase in demand.
The breakout mechanism is clearly visible through the behavior of the Bollinger Bands. For several days leading up to the current move, the bands were contracting, signaling a volatility squeeze. The subsequent price expansion has forced the bands to widen aggressively, with price action riding the Upper Bollinger Band (currently around 1.6437). This "band riding" behavior is typical of strong impulsive moves where momentum is sufficient to keep the asset in overbought territory for extended periods.
Furthermore, the Moving Averages provide confirmation of a trend reversal. The 7-period EMA has crossed above the 25-period and 99-period EMAs, creating a bullish alignment. The fanning out of these averages suggests that momentum is accelerating across multiple timeframes. The 99-period EMA, which acted as dynamic resistance during the descent to 1.3260, has now been reclaimed and may serve as a dynamic support level in the event of a deep retracement.
Volume analysis corroborates the price move. The breakout candles are accompanied by a noticeable uptick in buying volume, validating the legitimacy of the move. A breakout on low volume is often a trap, but the participation levels here suggest genuine capital inflows. However, the RSI is currently elevated, hovering above the 70 level. While this confirms strong bullish momentum, it also warrants caution regarding a potential mean reversion or consolidation to cool off the oscillator before further upside can be realized.
News Drivers
The technical breakout is underpinned by a series of fundamental developments that provide a narrative tailwind for SUI. The news cycle surrounding the project has coalesced around three primary themes: technical price targets, product roadmap evolution, and regulatory compliance.
First, technical forecasts from market observers have aligned with the bullish chart structure. Recent analysis points to a price target range of $1.70 to $2.10 within a 4-6 week horizon. This projection is based on MACD divergence and the expectation of a recovery phase. The current price of 1.62 is rapidly approaching the lower bound of this target zone ($1.70). The alignment of third-party technical analysis with the actual price action reinforces the probability of the trend continuing, although the expectation of "near-term consolidation" mentioned in the reports aligns with the overextended RSI reading on the 4-hour chart.
Second, and perhaps more structurally significant, is the confirmation from Mysten Labs regarding the introduction of private transactions in 2026. While the timeline is long-term, markets often discount future utility well in advance. The announcement by co-founder Adeniyi Abiodun positions privacy not merely as a feature for anonymity, but as a prerequisite for scaling on-chain payments. This narrative shifts the perception of SUI from a general-purpose L1 to a protocol specifically engineering solutions for real-world commercial adoption, where transaction confidentiality is non-negotiable.
Third, the nuance of "regulated on-chain payments" is a critical differentiator. The news highlights that these private transactions will be regulation-compliant, allowing for selective transparency and authorized auditing. In the current regulatory climate, where privacy coins face delistings and scrutiny, SUI's approach to compliant privacy creates a "regulatory moat." This is a bullish fundamental driver as it appeals to institutional capital that requires both privacy for operations and compliance for legality. The combination of these news items suggests that the current price action is not merely speculative noise but a repricing event based on SUI's evolving value proposition.
Scenario A: Bullish Continuation via Consolidation
In the primary bullish scenario, SUI maintains its structural integrity above key breakout levels. The market anticipates a continuation of the impulsive move, but healthy price action rarely moves in a straight line. For this scenario to validate, price must accept the 1.58 - 1.60 region as new support. This area represents the top of the previous consolidation range and the location of the rising 7-period EMA.
We would look for price to consolidate sideways or flag slightly downward, allowing the RSI to reset from overbought conditions without surrendering significant price levels. A successful defense of the 1.58 level, followed by a high-volume breach of the recent local high (1.6913), would open the path toward the $1.70 psychological level and the $1.80 extension. This move would likely be driven by trend-following algorithms and late entrants seeking exposure to the breakout. The "private transaction" narrative provides the fundamental justification for long-term holders to refrain from selling, reducing overhead supply as price climbs.
Scenario B: The Bull Trap and Range Re-entry
The alternative scenario considers the possibility of a "bull trap" or a failed breakout. This is a risk when volatility expands rapidly into a liquidity pocket without sustained follow-through. If the current move to 1.62 is simply a liquidity grab to fill short orders before a reversal, we will see a swift rejection.
Invalidation of the bullish bias would occur if SUI closes a 4-hour or daily candle back below the 1.48 - 1.50 level. This zone was the previous resistance; failing to hold it as support would indicate weakness. A breakdown below this level would trap buyers who entered above 1.60, forcing liquidations that could drive price back down toward the mean, likely retesting the 99-period EMA or the mid-range around 1.40. This scenario would suggest that the market views the 2026 timeline for privacy features as too distant to warrant an immediate premium, leading to a "sell the news" reaction after the initial pop.
What to Watch Next
Traders and analysts should focus on three specific metrics in the immediate term to gauge the probability of Scenario A versus Scenario B.
First, monitor the volume profile on pullbacks. In a healthy trend, pullback candles (red candles) should have significantly lower volume than the breakout candles. If selling volume spikes on a dip to 1.60, it indicates distribution rather than accumulation.
Second, watch the reaction at the 1.70 psychological resistance. There is likely a cluster of limit sell orders at this round number. How price reacts here—whether it rejects sharply or grinds through—will determine the strength of the trend. A clean break of 1.70 validates the medium-term targets mentioned in recent reports.
Third, observe the 4-hour RSI for "hidden bullish divergence." If price makes a lower low on a micro-timeframe but RSI makes a higher low, it suggests the uptrend is intact despite surface-level weakness. Conversely, "regular bearish divergence" (higher price, lower RSI) would signal waning momentum and an impending correction.
Risk Note
While the technicals and news flow are currently supportive, the crypto market remains highly sensitive to macro-financial conditions. The expansion of Bollinger Bands indicates high volatility, which works in both directions. The leverage profile in the derivatives market should be monitored; high open interest coupled with a stalled price often precedes a liquidation cascade. Furthermore, the long timeline for the implementation of private transactions (2026) introduces execution risk—promises of future tech do not guarantee delivery or adoption. Market participants should manage risk by defining invalidation points clearly and avoiding over-leverage during volatility expansion phases.
SUI is currently exhibiting a textbook breakout from accumulation, supported by a distinct fundamental thesis regarding compliant privacy, yet the sustainability of this move depends on the market's ability to convert previous resistance levels into support in the coming sessions.