The price action of HYPE is currently presenting one of the most technically and fundamentally conflicting setups in the perpetual DEX sector. As the broader crypto market navigates the opening weeks of 2026, Hyperliquid (HYPE) finds itself at a decisive crossroads. The asset is currently consolidating after a significant correction from its valuation peaks, trading in a tightening range that suggests a volatility expansion is imminent. While the project’s leadership is doubling down on a narrative of "credible neutrality" and an insider-free tokenomics model, the market is simultaneously digesting concerning data regarding a sharp contraction in market share. This analysis dissects the friction between the bullish ideological stance of the project and the bearish reality of its current usage metrics, overlaid against a 4-hour technical structure that indicates a breakout is approaching.
Market Snapshot
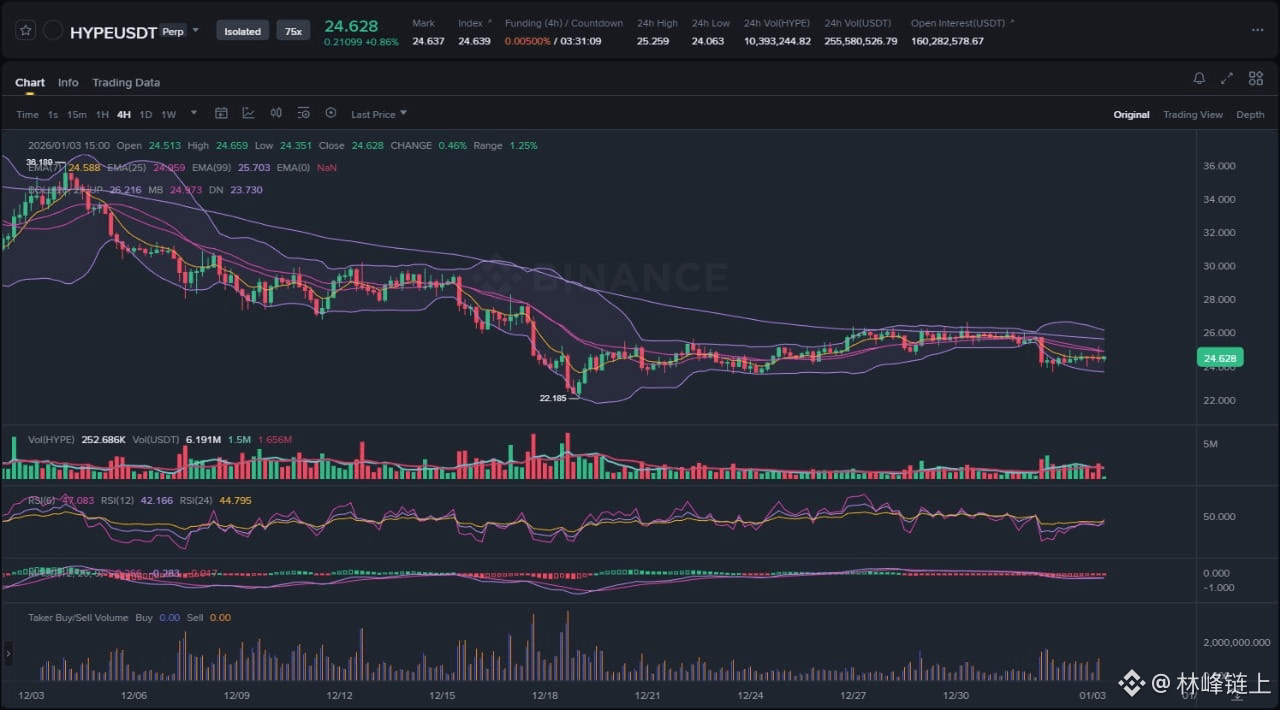
At the time of writing, HYPE is trading near the 24.62 mark, showing a slight intraday recovery of approximately 0.46%. The asset has established a trading range following a capitulation event that saw prices wick down to a local low of 22.185. Since that liquidity sweep, the price action has compressed significantly. The volatility that characterized the drop from the 36.00 highs has evaporated, replaced by a tightening consolidation pattern. This compression is visible across multiple timeframes but is most distinct on the 4-hour chart, where the price is oscillating strictly between the upper and lower Bollinger Bands. The market is effectively in a "wait-and-see" mode, pausing to determine whether the current levels represent a value accumulation zone for long-term holders or a redistribution pause before a continuation of the downtrend.
Chart Read: Structure and Technical Bias
The dominant market structure on the 4-hour chart remains bearish to neutral. The macro view from the left side of the chart shows a clear sequence of lower highs and lower lows, originating from the 36.00 region. The descent was sharp and impulsive, characterized by wide price spreads and heavy selling volume, indicating a strong distribution phase where supply overwhelmed demand.
However, the recent price action suggests a potential shift in character. Following the capitulation wick to 22.185, the market refused to accept lower prices. The subsequent recovery was not V-shaped but rather evolved into a flat consolidation structure. This is a critical observation. The price is currently hugging the mid-range moving averages, specifically interacting with the 25-period and 99-period EMAs. The convergence of these moving averages signifies a loss of directional momentum. The market is no longer trending; it is bracketing.
A key technical element to observe is the behavior of the Bollinger Bands. The bands are squeezing tightly around the price action. In technical analysis, periods of low volatility (the squeeze) are almost invariably followed by periods of high volatility (the expansion). The bands are currently flat, indicating that the standard deviation of price movement has collapsed. This is a precursor to a breakout, but the direction remains ambiguous based solely on the bands.
Volume analysis provides further context. The volume bars at the bottom of the chart show a distinct drying up of activity compared to the mid-December sell-off. The aggressive red volume spikes seen during the drop to 22.00 have subsided, replaced by lower, mixed volume. This decline in volume during a consolidation is typical, but for a bullish reversal to be confirmed, we would need to see a significant expansion in buy-side volume to validate renewed interest.
The Relative Strength Index (RSI) is hovering near the 50 level, currently reading around 42-47. This is the definition of neutrality. It confirms that neither bulls nor bears are in control of the immediate momentum. The MACD is also flattening near the zero line, showing a lack of divergence or convergence momentum.
Based on the chart alone, the bias must remain cautiously neutral with a bearish undertone due to the prevailing downtrend structure. Until the market can reclaim the breakdown levels above 26.00 and establish a higher high, the path of least resistance technically remains downward or sideways.
News Drivers: Ideology vs. Metrics
The fundamental backdrop for HYPE is currently a battleground between long-term philosophical value and short-term performance metrics. Three key news items are driving sentiment, creating a complex narrative for investors to navigate.
The first major theme is the "Credible Neutrality" narrative. The Hyperliquid founder has explicitly reasserted a hardline ethos regarding the project’s structure, emphasizing that "No Insiders Allowed." This is a direct appeal to the crypto-native ethos of decentralization and fair launches. By refusing backroom economics and insider allocations, Hyperliquid is positioning itself as the "people’s DEX." In the long run, this is a bullish differentiator. It builds trust and creates a cult-like community following that is resistant to the predatory dumping often seen in VC-backed tokens. This narrative is further bolstered by the project capitalizing on the recent uproar surrounding the Lighter DEX, where alleged undisclosed deals and unfair airdrops caused a community revolt. By positioning HYPE as the antithesis to Lighter DEX, the team is attempting to capture frustrated liquidity and users looking for a fair playing field.
However, the second theme is decidedly bearish and presents a stark conflict with the ideological narrative. Recent reports indicate that Hyperliquid’s market share has contracted severely, dropping from a dominant 75% to a concerning 19%. This is a fundamental red flag that cannot be ignored. While the "No Insider" stance is excellent for marketing, the market share data suggests that users are migrating elsewhere. This contraction could be due to a lack of incentives that VC-backed chains can afford to offer, or simply a rotation of capital to newer, shinier protocols.
This creates a divergence between sentiment and reality. The news sentiment regarding the project's integrity is positive, but the news regarding its actual business performance is negative. When fundamentals (market share) degrade while price consolidates, it often creates a "sell the news" environment unless the trend can be arrested immediately. The market is asking: "If the ethos is so good, why is the market share plummeting?" This question is the primary weight on the price action.
Scenario A: Bearish Continuation (The Fundamental Drag)
In this primary scenario, the weight of the contracting market share (from 75% to 19%) overpowers the positive sentiment regarding the project's ethos. The market interprets the current consolidation not as accumulation, but as a pause in distribution—a "bear flag" or a "stair-step" pattern downward.
For this scenario to play out, we would expect the price to face rejection at the upper Bollinger Band or the 99-period EMA, currently sitting near the 25.50 - 25.70 region. If the price attempts to rally but fails to close above this resistance block on the 4-hour chart, it signals that demand is exhausted. The specific trigger for this scenario would be a high-volume rejection candle leaving a long upper wick.
Following the rejection, the price would likely drift back toward the median of the range before testing the lower support structures. The critical level to watch is the recent local support around 23.80. A 4-hour candle close below 23.80 would invalidate the current stabilization thesis and open the door for a retest of the capitulation low at 22.185.
If the 22.185 level is revisited, the likelihood of a breakdown increases significantly. A breach of this level would confirm the continuation of the macro downtrend, likely targeting psychological support levels near 20.00. This scenario assumes that the market prioritizes liquidity and volume metrics over governance philosophy in the short term.
Scenario B: Bullish Reversal (The Ethos Premium)
The alternative scenario relies on the market pricing in a "governance premium." In this view, the "No Insider" narrative acts as a floor for the price, attracting long-term capital that values safety and fairness over short-term yield farming. Here, the current consolidation is viewed as an accumulation phase where smart money is absorbing the supply from weak hands who are exiting due to the market share news.
For this scenario to materialize, HYPE needs to reclaim the 26.00 level with conviction. This level is crucial because it represents the top of the current consolidation block and aligns with previous support-turned-resistance. A breakout above 26.00 would also clear the 99-period EMA, signaling a shift in trend direction.
The catalyst for this move would likely be a "short squeeze" triggered by the tightening Bollinger Bands. If price pushes above 25.25 and sustains momentum, late shorters could be forced to cover, driving the price rapidly toward the 28.00 - 30.00 liquidity pockets.
In this scenario, the market share drop is interpreted as a temporary fluctuation or a "wash-out" of mercenary capital, leaving a healthier, more organic user base. The chart would likely print a "higher low" structure above 24.00 before launching the breakout.
What to Watch Next
Traders and analysts should focus on three specific actionable signals in the coming 24 to 48 hours.
First, monitor the volume signature on any move outside the 24.00 - 25.50 range. The current low volume is sustainable only during the squeeze. A breakout (up or down) must be accompanied by a volume spike at least 2x the current average to be considered valid. A low-volume breakout is likely a "fakeout" designed to trap liquidity.
Second, watch the reaction at the EMA cluster. The 7, 25, and 99 EMAs are compressing. Watch for the "fanning out" of these lines. If the shorter-term EMAs (7 and 25) cross aggressively above the 99 EMA, it is a strong buy signal. Conversely, if they are rejected and curl down, it confirms bearish momentum.
Third, keep a close eye on the funding rates and Open Interest (OI) specifically for HYPE. Given the "DEX Wars" narrative, if Open Interest begins to rise while price remains flat, it indicates positions are building up for a big move. If OI rises and funding turns negative, it suggests the market is betting on a breakdown (Scenario A). If OI rises with positive funding, it suggests confidence in the recovery (Scenario B).
Risk Note
It is vital to remember that HYPE is currently trading in a high-risk environment. The contraction in market share is a significant fundamental headwind that historically correlates with price depreciation. While the technicals show stabilization, "catching a falling knife" based on ethos alone carries substantial risk. The Bollinger Band squeeze guarantees volatility, but it does not guarantee direction. Investors should exercise strict risk management, particularly around the 22.185 support level, as a breach there could trigger a cascade of stop-losses.
In conclusion, Hyperliquid is testing the conviction of its holders. The chart shows a coiled spring ready to release, but the direction will depend on whether the market values the "fair launch" narrative more than the current decline in usage metrics.