Based on the chart you shared for $GUN/USDT, here is a breakdown of what the current technical indicators are suggesting.
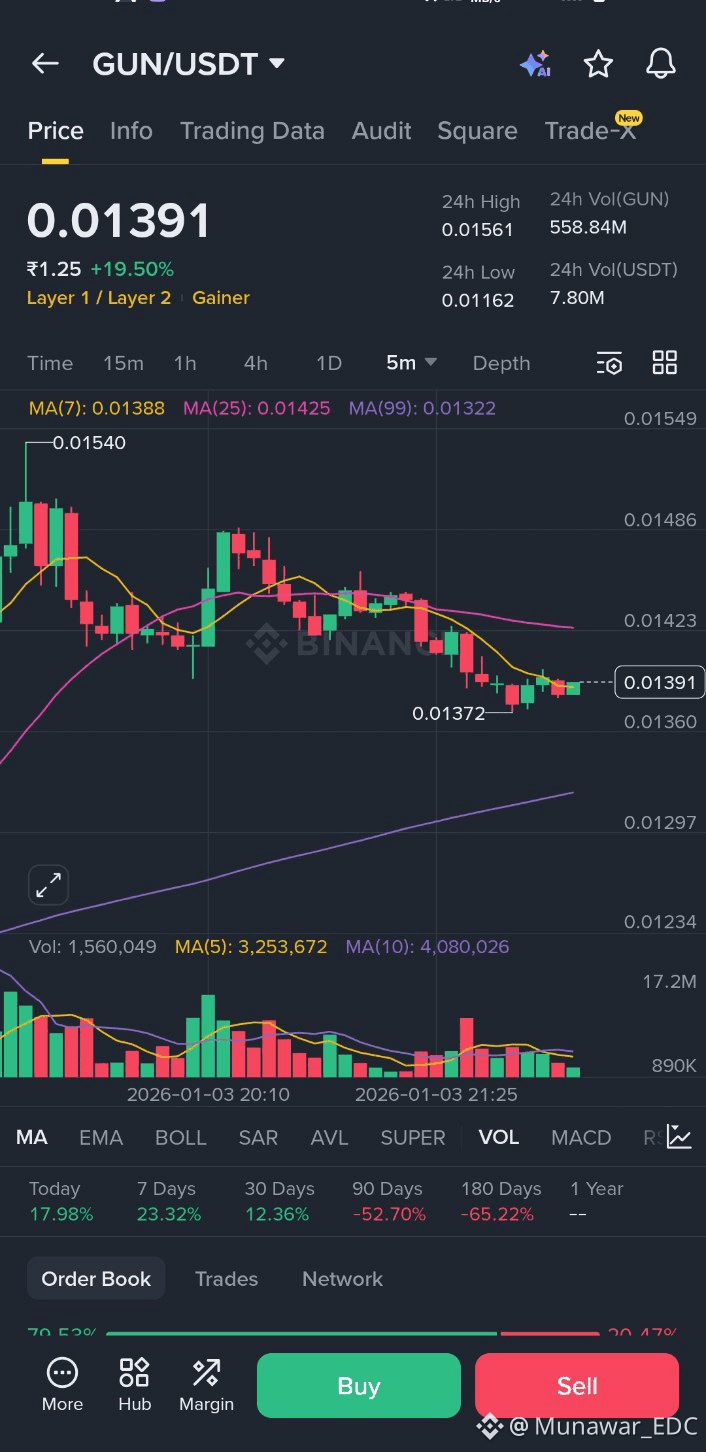
Currently, the price is at 0.01391, showing a strong daily gain of +19.50%. However, the short-term 5-minute chart shows some immediate challenges.
1. Moving Averages (MA)
The price is currently sandwiched between different Moving Averages, which creates a "squeeze" effect:
MA(7) (Yellow - 0.01388): The price is sitting right on top of this. It is acting as immediate support.
MA(25) (Pink - 0.01425): This is acting as overhead resistance. The price recently tried to break above this and failed, leading to the current dip.
MA(99) (Purple - 0.01322): This represents the longer-term trend on this timeframe. As long as the price stays above this, the local trend remains bullish.
2. Support and Resistance Levels
Looking at the recent "wicks" and candle bodies:
Immediate Resistance: 0.01425 (the pink line). A clean break above this is needed to see another "leg up."
Immediate Support: 0.01372. This was the recent low point on the chart. If it falls below this, the next stop is likely the purple MA at 0.01322.
3. Volume Trends
The volume bars at the bottom show a decrease in buying pressure compared to the large spikes seen earlier in the session. When volume drops while the price consolidates, it often precedes a "breakout" or "breakdown."
