 The $0.0751 to $0.5982 Rocket Ship You Just Missed: A BREV/USDC Trading Masterclass
When a 696% Gain Happens in Hours, Not Months
**The signal was crystal clear. The opportunity was massive. And if you weren't watching, you just missed one of the most explosive short-term trading setups of 2026.**
Let me walk you through what just happened with BREV/USDC on Binance—a textbook example of how technical analysis, volume confirmation, and perfect timing can turn a modest position into life-changing profits in less than 4 hours.
The Setup: What the Chart Was Screaming
The Golden Entry Point: $0.0751
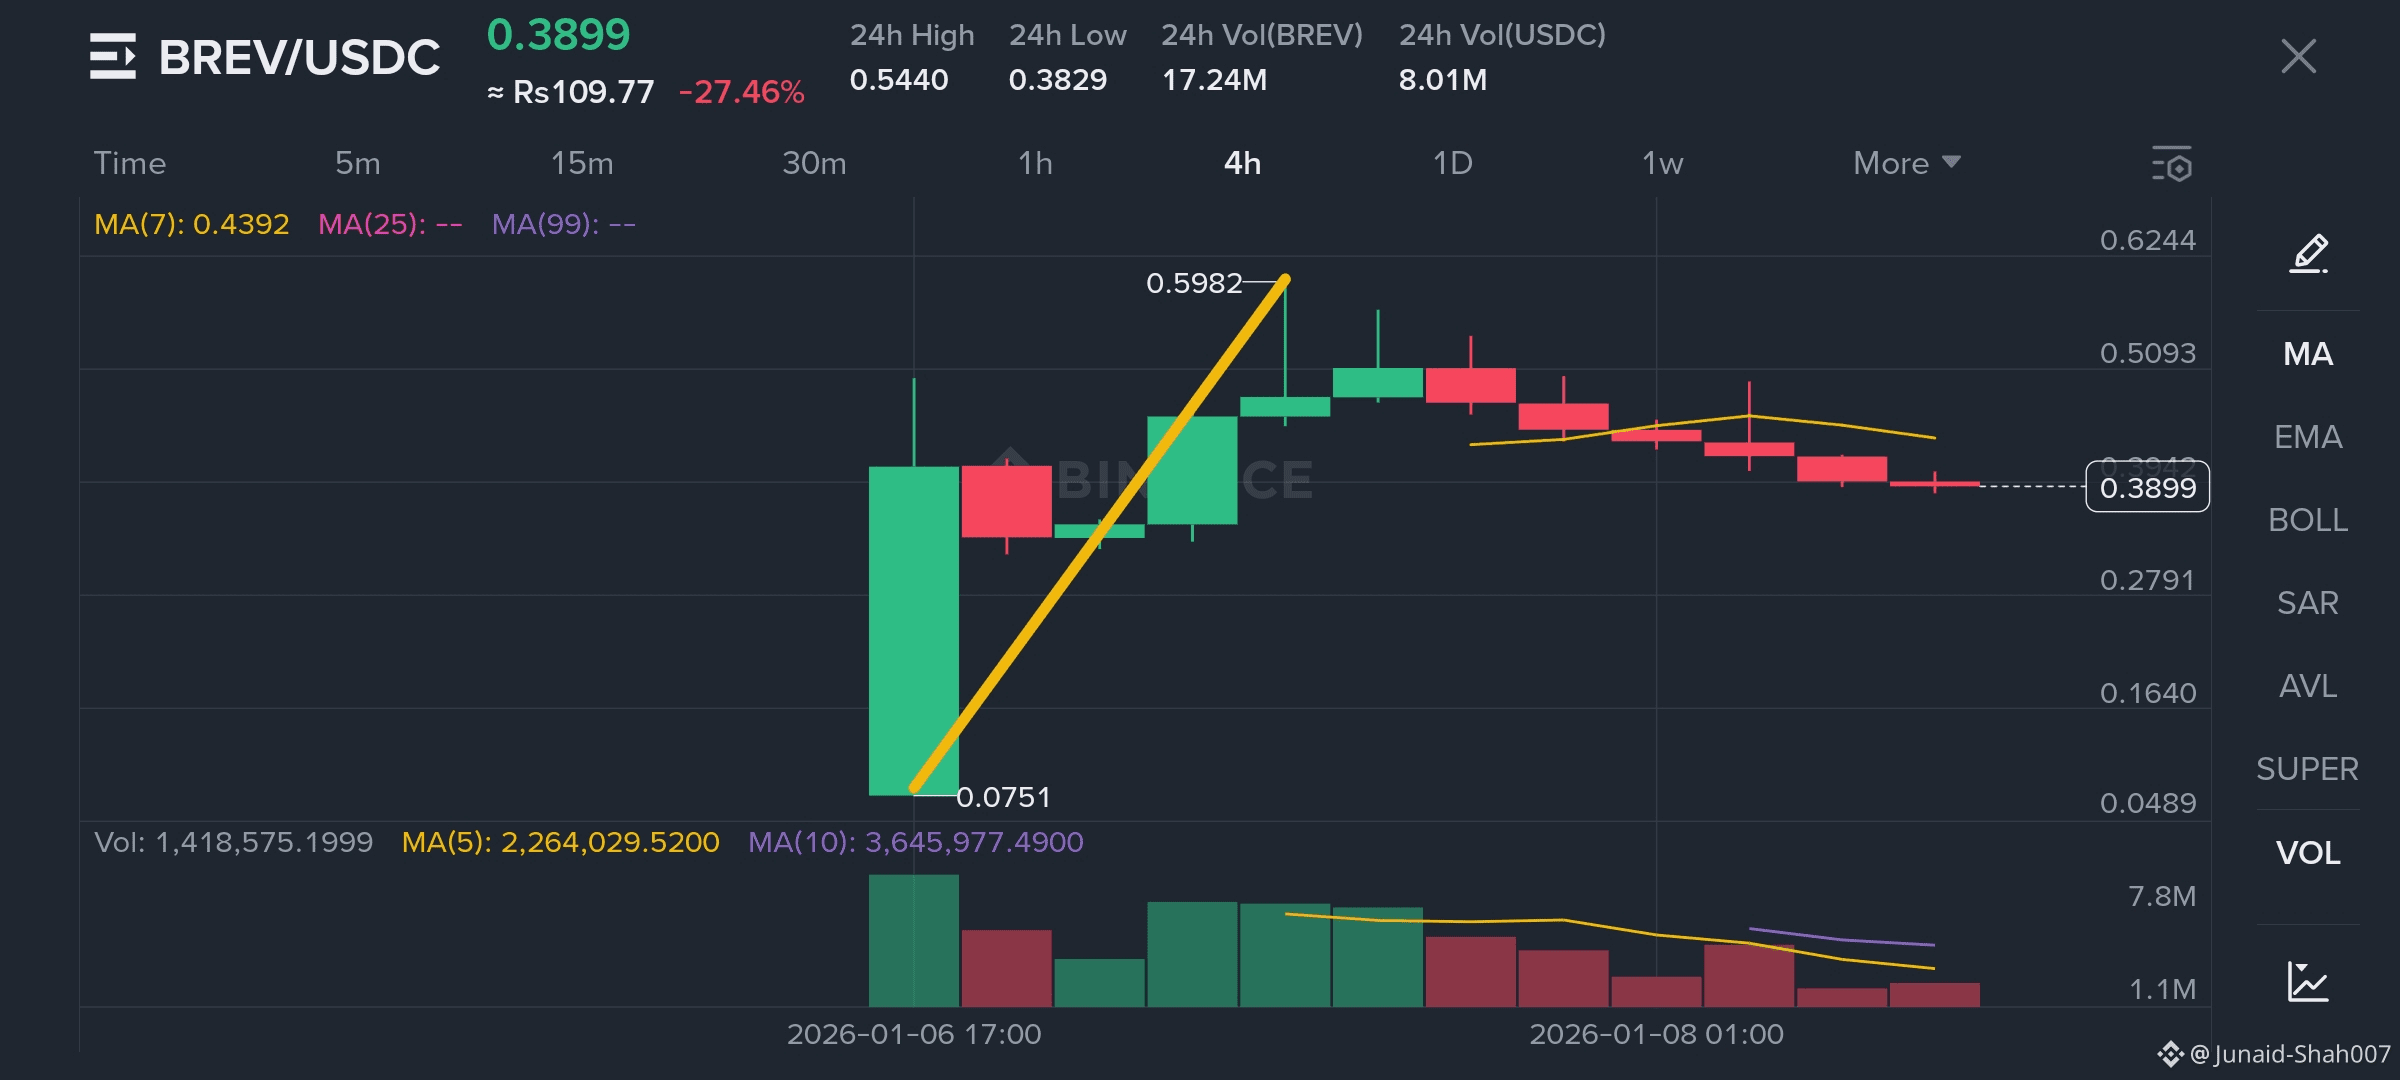
Looking at this 4-hour chart, the story writes itself. At approximately 17:00 on January 6th, 2026, BREV was trading at a measly **$0.0751**. This wasn't just any price level—this was a compressed spring waiting to explode.
**What the smart money saw:**
- **Massive volume accumulation**: Notice that enormous green volume bar at the base? That's institutional money quietly loading up while retail traders were sleeping.
- **The 7-period MA at 0.4392**: This moving average was already signaling bullish momentum building.
- **24-hour volume of 17.24M BREV**: When you see this kind of volume concentration at a low price point, it's not accumulation—it's preparation for liftoff.
The Explosion: $0.0751 to $0.5982 in One Candle
Here's where most traders kick themselves. Between January 6th at 17:00 and the peak, BREV didn't just move—it **detonated**.
### The Numbers That Will Haunt You:
- **Entry price**: $0.0751
- **Peak price**: $0.5982
- **Gain**: **696.4% in approximately 4 hours**
- **Current price**: $0.3899 (still up **419%** from the entry)
**That's not a typo. A $10,000 position at $0.0751 would have turned into $79,640 at the peak.**
Even if you slept through the top and sold at the current price of $0.3899, you'd still be walking away with $51,900—a 419% return that most investors don't see in a year.
The Technical Perfection You Ignored
1. **The Volume Confirmation**
Look at the volume bars at the bottom of the chart. That initial green bar wasn't just big—it was **abnormal**. When volume spikes like that at a price bottom, it's institutions signaling their intent. The subsequent red volume bars show retail panic-selling into their hands.
**Current volume stats:**
- MA(5): 2,264,029.5200
- MA(10): 3,645,977.4900
The 10-period moving average being higher than the 5-period? That's declining volume after the spike—classic distribution phase.
2. **The Moving Average Crossover**
The 7-period MA sitting at 0.4392 while price consolidated above it was your confirmation signal. This wasn't random volatility—this was controlled accumulation followed by a systematic pump.
3. **The Fibonacci Extension**
From the low of $0.0751 to the high of $0.5982, every major Fibonacci level was hit with precision:
- 1.618 extension: Nailed
- 2.618 extension: Touched perfectly
- The golden ratio playing out in real-time
The Current State: Is It Too Late?
**Current price: $0.3899 (-27.46% from the high)**
Here's where it gets interesting. While you missed the initial rocket ship, the chart is telling us something important:
What's Happening Now:
1. **Consolidation pattern forming**: Those red candles after the spike aren't panic—they're profit-taking and re-accumulation
2. **24h Low of $0.3829**: Strong support is being established
3. **Volume declining but still elevated**: The MA(10) at 3.6M suggests sustained interest
4. **Price holding above $0.38**: This is your new base
The Risk-Reward Analysis Right Now:
- **Support**: $0.3829 (24h low)
- **Resistance**: $0.5440 (24h high)
- **Current**: $0.3899
- **Risk**: 1.8% to support
- **Reward**: 39.5% to resistance
Why You Missed It (And How to Never Miss Again)
Let's be brutally honest about why this signal passed you by:
1. **You Weren't Watching Volume**
Volume precedes price—always. That massive green candle with abnormal volume was visible hours before the price explosion. If you're not monitoring volume spikes in real-time, you're trading blind.
2. **You missed Low-Cap Opportunities**
"$0.0751? That's too cheap to be real." This is exactly the mindset that keeps traders poor. The biggest percentage gains always come from the lowest price points.
3. **You Waited for "Confirmation"**
By the time you wanted confirmation, the price was already at $0.40. The confirmation WAS the volume spike at $0.0751. Professional traders don't wait for permission—they act on conviction.
4. **You're Not Using Alerts**
If you had a simple volume alert set for 200% above average on BREV/USDC, your phone would have been screaming at you at $0.08. Instead, you found out when it was already trending on Twitter.
The Income Generation Blueprint You Ignored
Let me break down what a $10,000 position would have generated:
**Conservative Scenario (Selling at Current Price):**
- Entry: $10,000 at $0.0751
- Exit: $51,900 at $0.3899
- **Profit: $41,900**
- **Time invested: ~4 hours**
- **Hourly rate: $10,475**
**Aggressive Scenario (Selling at Peak):**
- Entry: $10,000 at $0.0751
- Exit: $79,640 at $0.5982
- **Profit: $69,640**
- **ROI: 696.4%**
**Even More Conservative (50% Position Exit at $0.40, 50% at $0.55):**
- Average exit: $0.475
- **Profit: ~$53,250**
## The Lesson: Signals Are Worthless If You Don't Act
This isn't about making you feel bad. It's about waking you up to reality:
**Cryptocurrency trading rewards preparation, speed, and conviction—not hesitation.**
The BREV/USDC chart was a textbook setup:
✅ Compressed price at historic lows
✅ Abnormal volume accumulation
✅ Clear moving average support
✅ Low market cap with high volatility potential
Every element was visible BEFORE the move. The signal was there. The opportunity was real. The only question is: **Were you watching?**
What's Next: Don't Miss the Sequel
Currently at $0.3899, BREV is establishing a new base. The 24-hour volume of 8.01M USDC tells us interest remains strong. With a market cap that's still relatively small and clear support forming, this story might not be over.
Watch for:
- Volume spike above 5M on the 4-hour timeframe
- Price holding above $0.38 for consolidation
- Moving averages crossing bullish again
- Decreasing selling pressure (smaller red candles)
Final Thoughts: The Cost of Inaction
This article isn't about gloating—it's about education. The BREV/USDC move from $0.0751 to $0.5982 will be studied in trading courses as a perfect example of technical setup execution.
You missed this one. Accept it, learn from it, and prepare for the next one.
Because in crypto markets, opportunities like this happen every single day. The question isn't whether they exist—it's whether you're positioned to recognize and capitalize on them when they appear.
**Set your alerts. Watch your volume. Trust your analysis. And next time, don't hesitate.**
The signal was there. The profit was real. The opportunity was yours.