⚠️This Chart Is Not About Headlines.
It Is About Cycles, Structure, And Repeating Behavior Over Time.
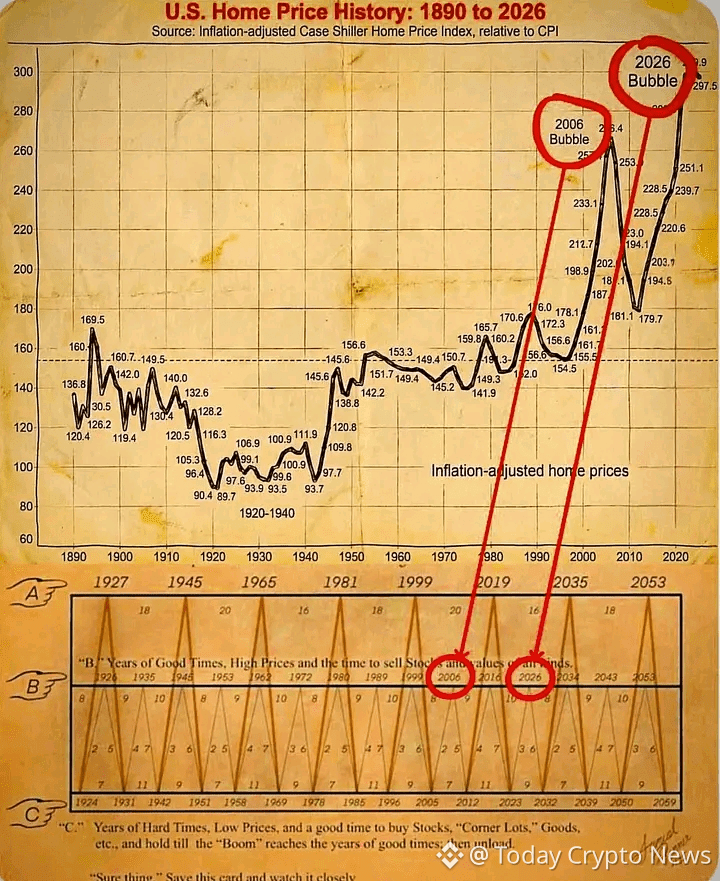
🆕When We View U.S. Home Prices On An Inflation-Adjusted Basis
A Clear Pattern Appears.
Long Periods Of Stability
Followed By Sharp Price Expansions
Ending In Mean Reversion Toward Historical Norms
The Highlighted Peaks Tell A Familiar Story.
🔥The 2006 Housing Cycle Was Not Just A Price Spike.
It Was Driven By:
Cheap Credit
Excess Leverage
Widespread Confidence That Prices Would Only Rise
What Came Next Is Well Known.🤔
Liquidity Tightened.
Forced Sellers Appeared.
Prices Slowly Moved Back Toward Long-Term Averages.
Now Look At The Current Cycle.
The Slope Moving Toward 2026 Is Steep And Accelerated.
This Is Not A Prediction.
It Is A Structural Observation Based On History.
Lower Cycle Bands Reinforce The Same Message.
Periods Of Elevated Prices Have Often Been Followed By Reset Phases.
Not Immediately — But Consistently.
What Makes This Cycle Different Is Duration, Not Immunity.
Years Of Low Rates Pulled Future Demand Forward.
That Demand Has Already Been Used.
As Affordability Tightens And Transactions Slow,
Price Discovery Becomes Weaker.
Markets Can Look Stable
Until They Are Not.
History Does Not Repeat Perfectly.
But It Rhymes With Accuracy ⚠️
The Takeaway Is Not Fear.
It Is Awareness.
Cycles Reward Patience.
They Punish Late Certainty.
The Chart Does Not Predict Dates.
It Highlights Risk Zones.
And 2026 Sits Clearly Inside One 📊