
Candlestick patterns are more than shapes — they reflect the real-time battle between buyers and sellers. Understanding them helps you anticipate moves instead of reacting late.
🔄 1. Engulfing Patterns — Momentum Shift Indicators
These patterns signal a strong change in market control.
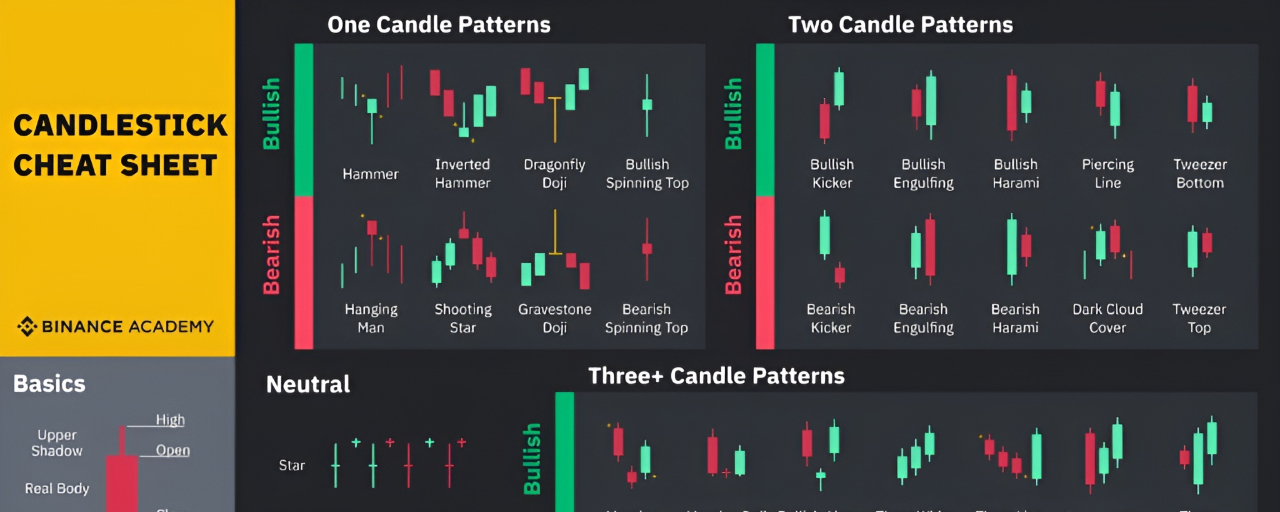
• Bullish Engulfing
A strong green candle fully covers the previous red candle
→ Indicates aggressive buying pressure
→ Often appears at the end of a downtrend
• Bearish Engulfing
A red candle engulfs the previous green candle
→ Signals strong selling pressure
→ Common near market tops
Insight: More reliable near key support and resistance levels
🧱 2. Order Blocks — Institutional Zones
Order blocks are areas where large players enter positions.
• Bullish Order Block → Buying interest and accumulation
• Bearish Order Block → Selling pressure and distribution
Insight: Price often revisits these zones before continuing its move
😶🌫️ 3. Doji Candles — Indecision Signals
Doji candles form when open and close prices are nearly equal.
• Neutral Doji → Market pause
• Dragonfly Doji → Potential bullish reversal
• Gravestone Doji → Potential bearish reversal
• Spinning Top → Weak momentum
Insight: Always wait for confirmation from the next candle
📉 4. Wick Rejection Patterns — Price Reaction Clues
Long wicks show rejection at key price levels.
• Hammer → Bullish rejection from lower levels
• Inverted Hammer → Possible reversal
• Shooting Star → Bearish rejection from highs
• Hanging Man → Weakening uptrend
Insight: Stronger when supported by volume and structure
✂️ 5. Tweezer Patterns — Quick Reversals
Formed when two candles share equal highs or lows.
• Tweezer Bottom → Potential upward move
• Tweezer Top → Potential downward move
Insight: Effective near support and resistance zones
⏱ 6. Timeframe Matters — Strength of Signals
Higher timeframes provide more reliable signals:
Weekly > Daily > 4H > 1H > Lower timeframes
Insight: Use higher timeframe for trend, lower timeframe for entries
🧠 7. Confluence — The Real Edge
Strong setups come from combining factors:
• Pattern + Support/Resistance
• Pattern + Trend Direction
• Pattern + Volume
• Pattern + Order Block
Rule: Avoid trading patterns in isolation
⚠️ Common Mistakes
• Ignoring the overall trend
• Trading without confirmation
• Overtrading on low timeframes
• Poor risk management
Final Takeaway
Candlestick patterns help you:
• Identify reversals early
• Improve entry timing
• Understand market behavior
• Trade with more discipline
Comment “🔥” if you want a candlestick cheat sheet, trade setups, and advanced breakdowns.