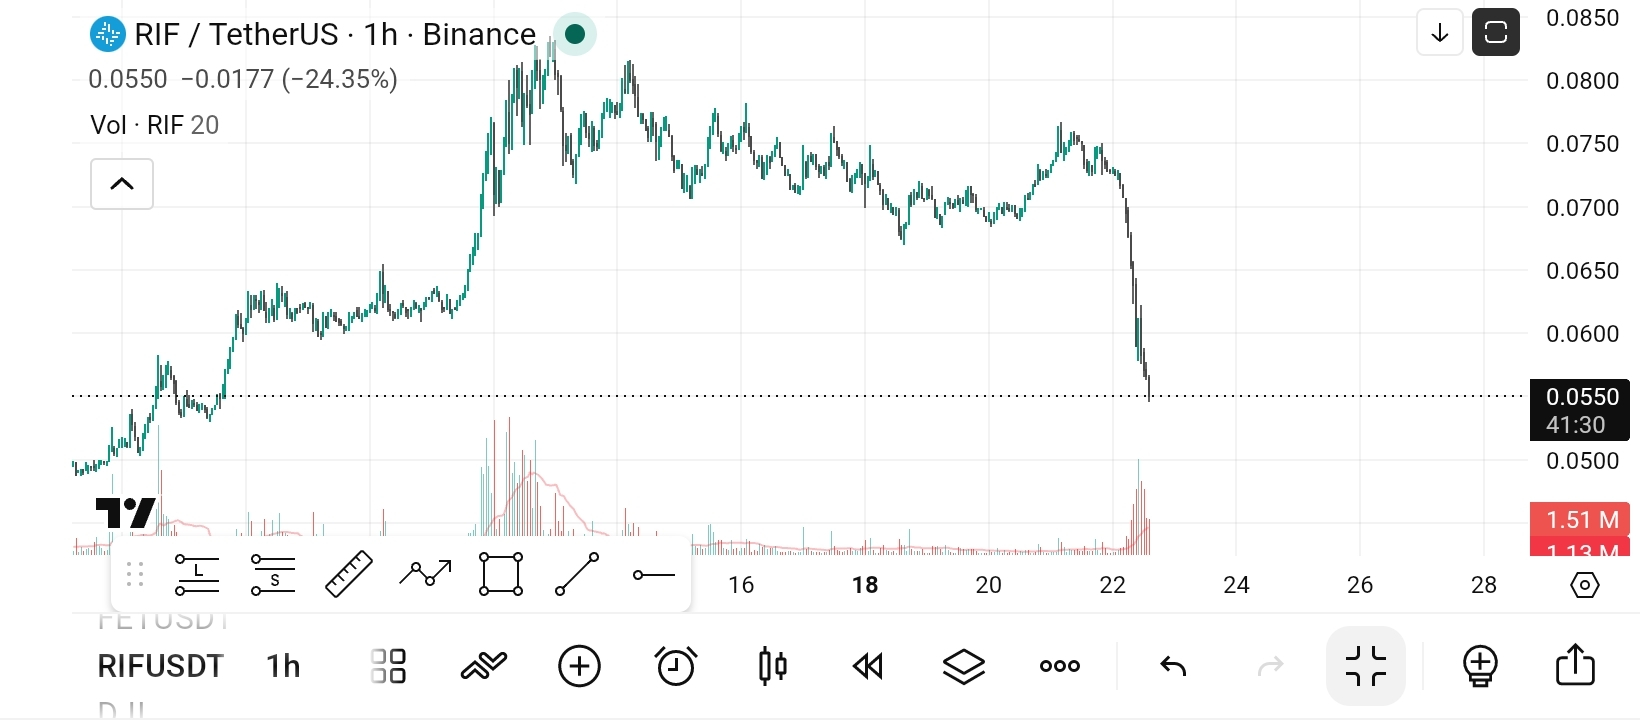
This RSK Infrastructure Framework chart looks much more dangerous than the previous ones. 📉
Here’s the full breakdown:
WHAT HAPPENED TO $RIF ?
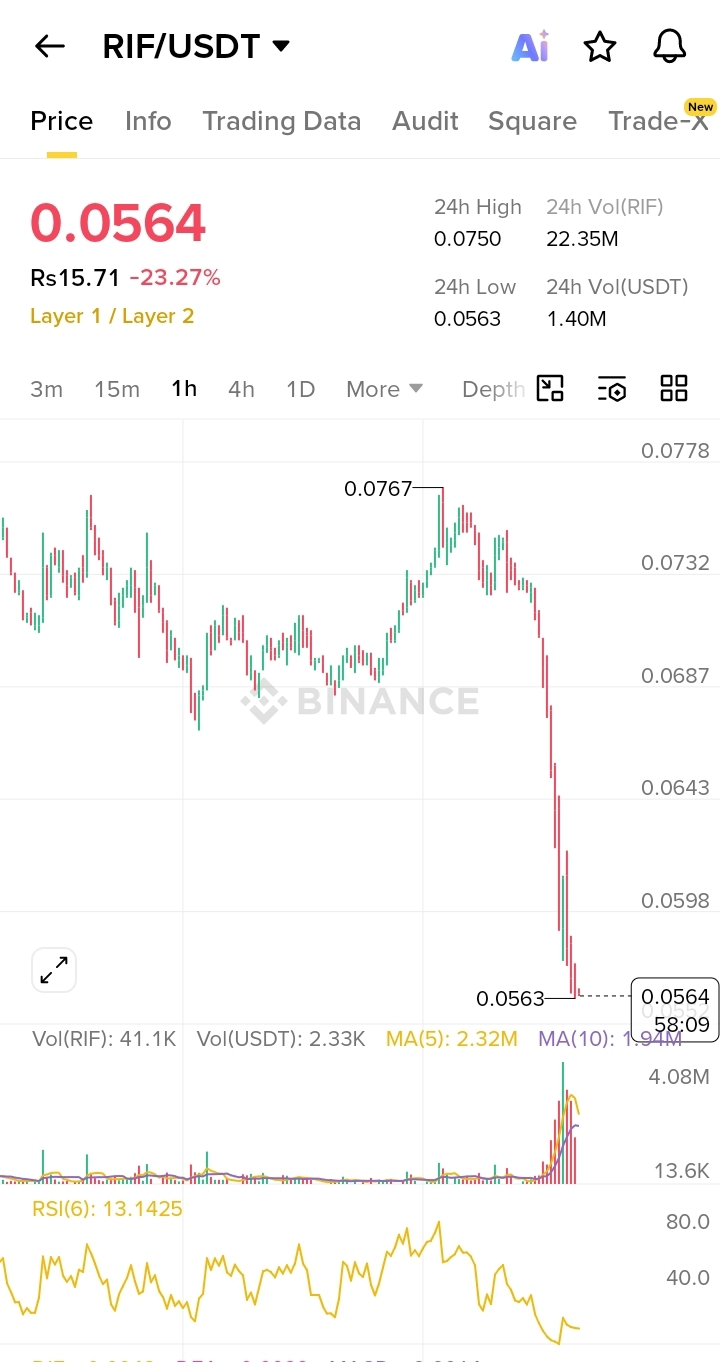
RIF crashed from around:
0.076 → 0.056 very quickly
That is a heavy dump, not a normal small correction.
The chart currently shows:
panic selling
liquidation pressure
very weak momentum
almost no strong bounce yet
THE BIGGEST WARNING SIGN ⚠️
RSI around 13
This is extremely oversold.
Normally:
RSI below 30 = oversold
RSI near 13 = extreme panic territory
This means :
sellers completely dominated
many traders likely panic sold
leveraged longs may have been liquidated
But important: Oversold does NOT mean instant recovery.
Coins can stay oversold during strong fear.
WHY DID IT FALL? 🔍
1. Massive Sell Pressure
The long red candles mean:
aggressive market selling
whales exiting
stop losses triggering rapidly
This creates a chain reaction.
2. Volume Explosion 🌋
Look at the huge volume spikes at the bottom.
That means:
many traders traded at once
fear became extreme
liquidity event happened
Usually this is caused by:
bad news
BTC weakness
whale selling
liquidation cascade
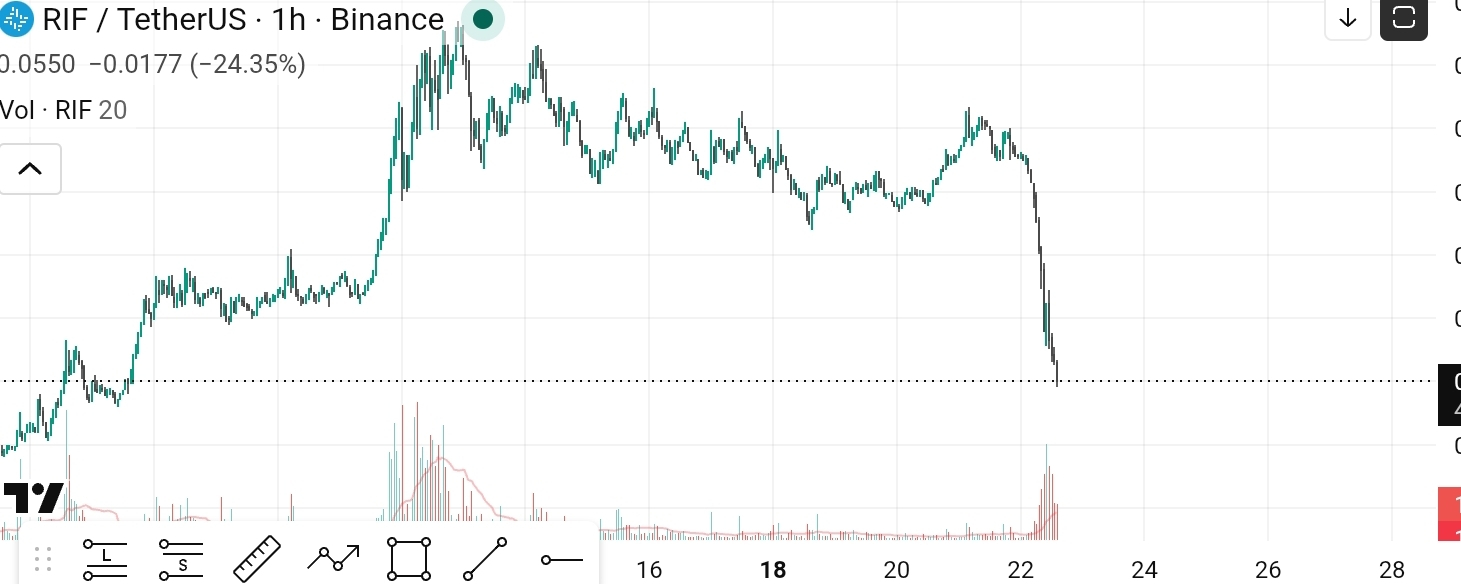
3. No Real Bounce Yet
This is important.
After huge dumps:
strong coins bounce fast
weak coins keep drifting lower
Right now RIF only showed a tiny stabilization near 0.056.
That means buyers are still cautious.
IMPORTANT PRICE LEVELS 📍
Support zones:
current support near 0.056
psychological support near 0.055
then lower support may appear near 0.050
If 0.056 breaks strongly:
another dump wave may happen.
Resistance zones:
0.060 then 0.064
major resistance near 0.068+
Those areas now contain trapped sellers waiting to exit.
CAN IT FALL MORE? 📉
Yes. Very possible right now.
Because: momentum is still bearish
RSI extremely weak
price structure damaged
no strong recovery candle yet
If BTC weakens too:
RIF could revisit lower zones quickly.
CAN IT BOUNCE? 📈
Also yes.
Extreme RSI levels sometimes create:
relief bounces
short squeezes
temporary recoveries
If buyers step in:
price may rebound toward 0.060 or 0.064
But currently any bounce still looks more like:
recovery attempt than a confirmed reversal.
HOW TO FIND THE REAL REASON FOR FALLING COINS 🔍
For any coin:
Step 1: Check BTC
If BTC drops:
altcoins usually crash harder.
Step 2: Check News
Search:
token unlock
hack
delisting
partnership failure
whale transfer
Step 3: Check Volume
Huge red volume = panic event.
Step 4: Check RSI
Very low RSI = fear zone.
Step 5: Watch Recovery Strength
Strong recovery = buyers active. Weak recovery = sellers still control.
My honest chart reading:
This currently looks like:
high fear
high volatility
unstable market structure
The chart needs:
stabilization
sideways movement
volume cooling
before a healthier recovery becomes likely.
Right now RIF looks like a market that just survived a storm but is still standing in the rain clouds 🌧️.