ARB/USDT Faces Strong Selling Pressure After Recent Rally
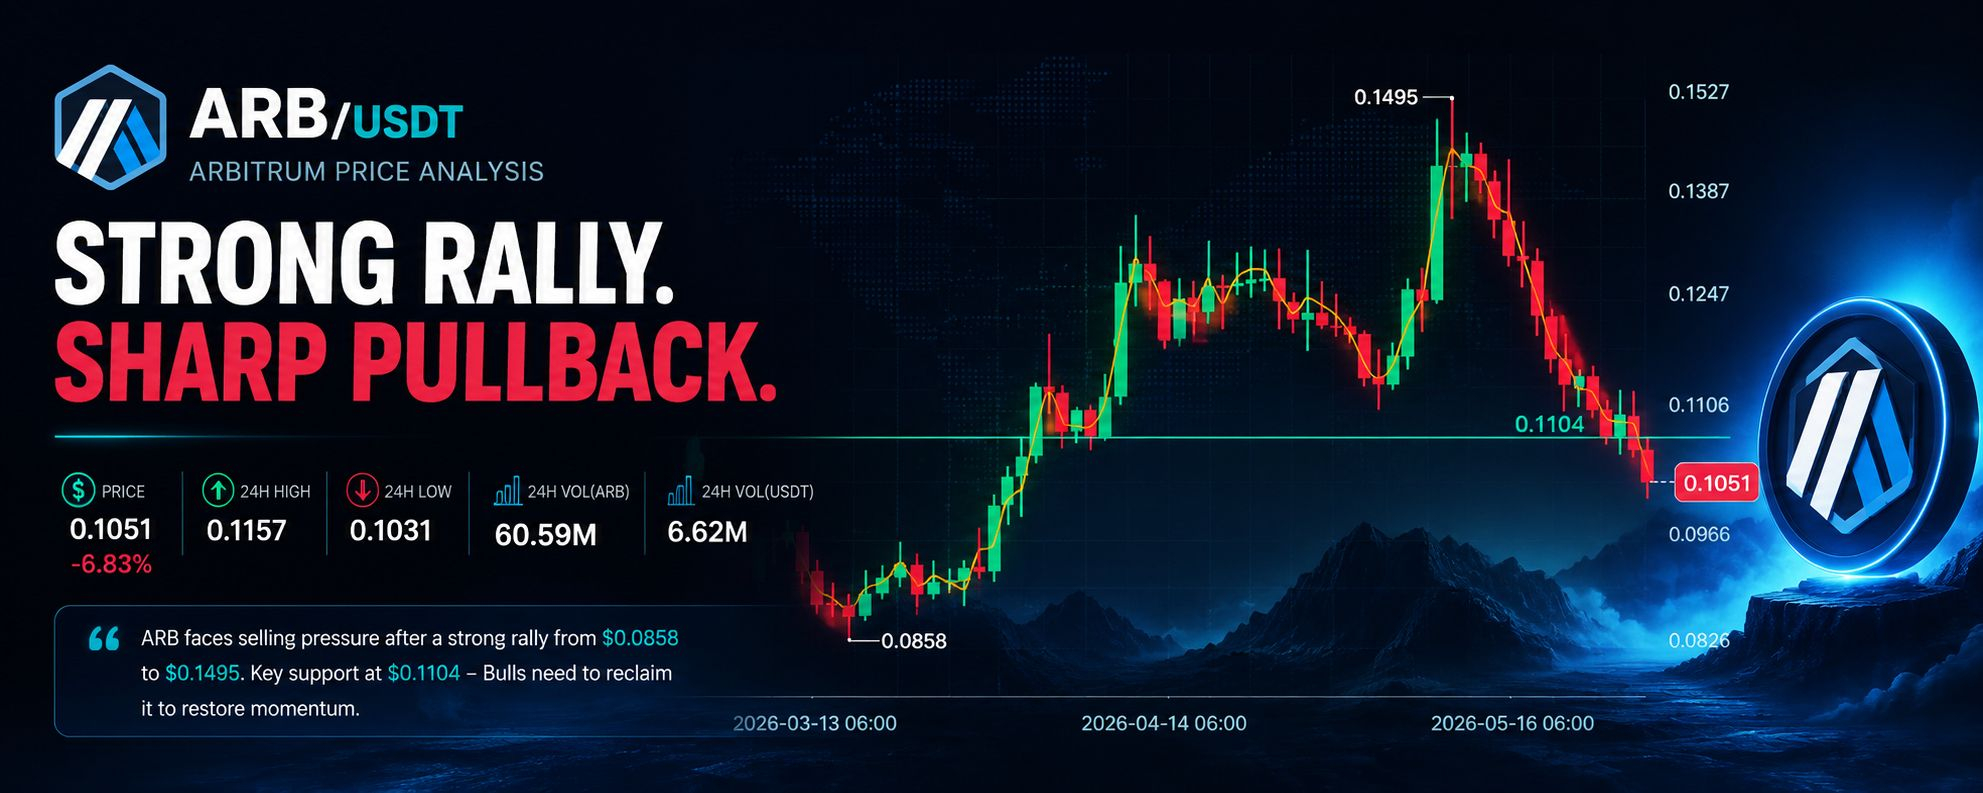
The $ARB /USDT daily chart shows that Arbitrum is currently trading near the $0.105 zone after experiencing a sharp correction from its recent local high around $0.1495. The chart reflects a strong bearish momentum over the past several sessions, with consecutive red candles pushing the price below an important support region near $0.1104.
Earlier, ARB formed a strong bullish breakout from the $0.0858 support area, creating an impressive upward rally that attracted significant buying interest. However, after reaching the peak near $0.1495, profit-taking pressure increased heavily, leading to a steady downward movement.
The current price action suggests that sellers remain in control in the short term. If ARB fails to reclaim the $0.1104 level quickly, the market could revisit the psychological support area near $0.1000. A breakdown below that zone may expose the token to further downside pressure toward previous support levels.
On the bullish side, a recovery above $0.1104 could help stabilize momentum and potentially trigger another attempt toward the $0.1240–$0.1300 resistance range. Trading volume and overall crypto market sentiment will play a major role in determining the next move.
Despite the current decline, the broader structure still shows that ARB has the ability to produce strong rebounds when buying momentum returns. Traders are now closely watching whether the market forms a new support base or continues its bearish correction in the coming days.
#ARB #SaylorConsidersBTCYearEndSale #CryptoArbitrage #Binance