After sliding 35% between Jan. 14 and Feb. 5, Bitcoin has moved sideways, holding between $60,000 and $70,000 for the past three weeks. Meanwhile, key adoption indicators across ETFs, whales, miners, and corporate treasuries are trending in different directions.
These mixed signals suggest quiet but persistent capital accumulation beneath the calm price range, offering a broader view of underlying market strength.
Bitcoin ETF flows remain negative
The 90-day rolling average of US spot Bitcoin ETF net flows has dropped to -$2.18 billion. Over the past two years, the metric has turned negative only twice: from March to May 2025, and in the current stretch that began on December 11, 2025. In both instances, Bitcoin followed with a corrective phase.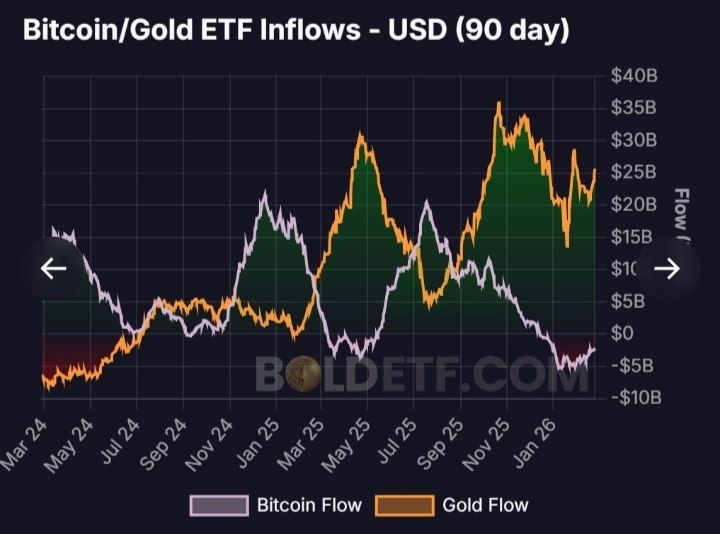
When the rolling average turns negative, it means more money is leaving ETFs than coming in over a longer period. That reduces buying pressure, weakens overall demand, and can make it harder for prices to move higher.
A move back above zero, followed by steady inflows, may mark the return of institutional participation. Sustained positive readings tend to align with stronger price action from BTC, alongside improving liquidity conditions.
BTC whale accumulation versus dominant trend
CryptoQuant data tracks the one-year change in total whale holdings and its 365-day moving average. Addresses holding 1,000 to 10,000 BTC added more than 200,000 BTC from June to November 2023, while the price ranged from $25,000 to $30,000.
When the raw one-year change crosses above its 365-day average, whales are accumulating faster than their longer-term trend. That crossover in 2023 coincided with supply absorption during sideways trade, which eventually led to BTC’s bullish rally.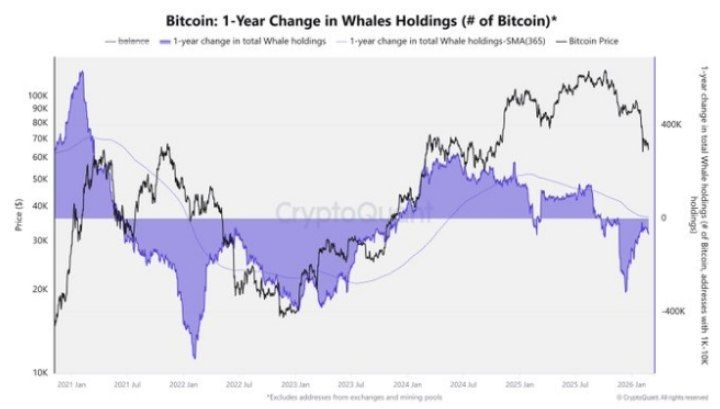
Thus, a bullish trend may unfold for BTC once the one-year change sustainably moves above its moving average (365-SMA), signaling renewed large-scale absorption.
Hash rate and infrastructure signal
Bitcoin’s 30-day mean hash rate stands near 0.99 ZH/s after peaking at 1.10 ZH/s in November 2025. Both hash rate and price have moved lower in recent weeks.
Hash rate measures the computational power securing the network and reflects miner investment in hardware and energy capacity. Rising hash rate during price consolidation points to infrastructure expansion independent of short-term price gains.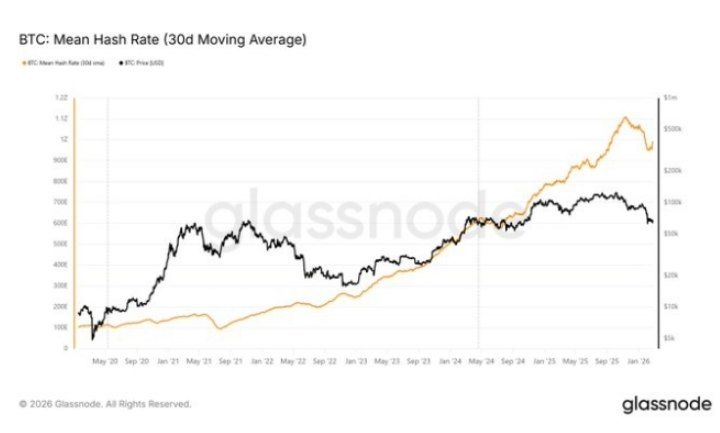
If the hash rate trends higher while the price trades sideways, it points to a stronger long-term commitment from miners. A sustained divergence, where hash rate rises ahead of price, can signal growing confidence within the mining sector.
Likewise, miner economics must also improve. Stabilizing the hash price and lower miner sell pressure confirms that rising computational power is backed by healthier revenue conditions rather than tightening margins.
Corporate Bitcoin treasury growth slows
According to a recent bitcointreasuries.net report, companies added roughly 43,200 BTC in January, with Strategy contributing about 40,150 BTC.
Looking at the bigger picture, Strategy’s corporate accumulation has decelerated noticeably since late 2024. Monthly additions hit highs of around 148,000 BTC in November 2024 and 87,000 BTC in July 2025.
Recent monthly increases are much smaller, and the past 30 days added only a slight uptick to the 1.13 million BTC currently held by public firms.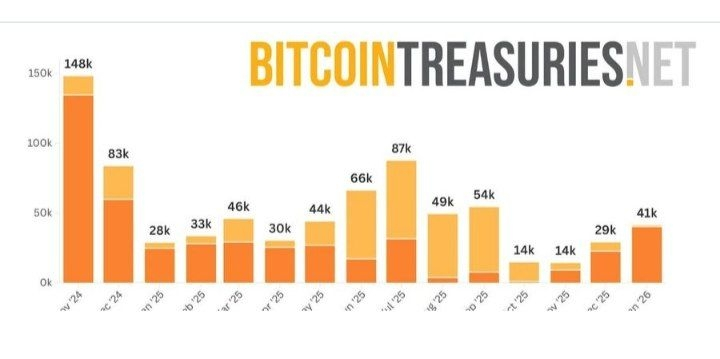
The latest monthly net increase equates to roughly 0.1% growth relative to total public company holdings. That pace signals stability rather than acceleration in treasury expansion.
For BTC price, broader and accelerating treasury inflows help absorb available supply more effectively. Slower increases, by contrast, signal companies are largely maintaining positions rather than driving new demand.