📉 Aktualna cena & kontekst trendu
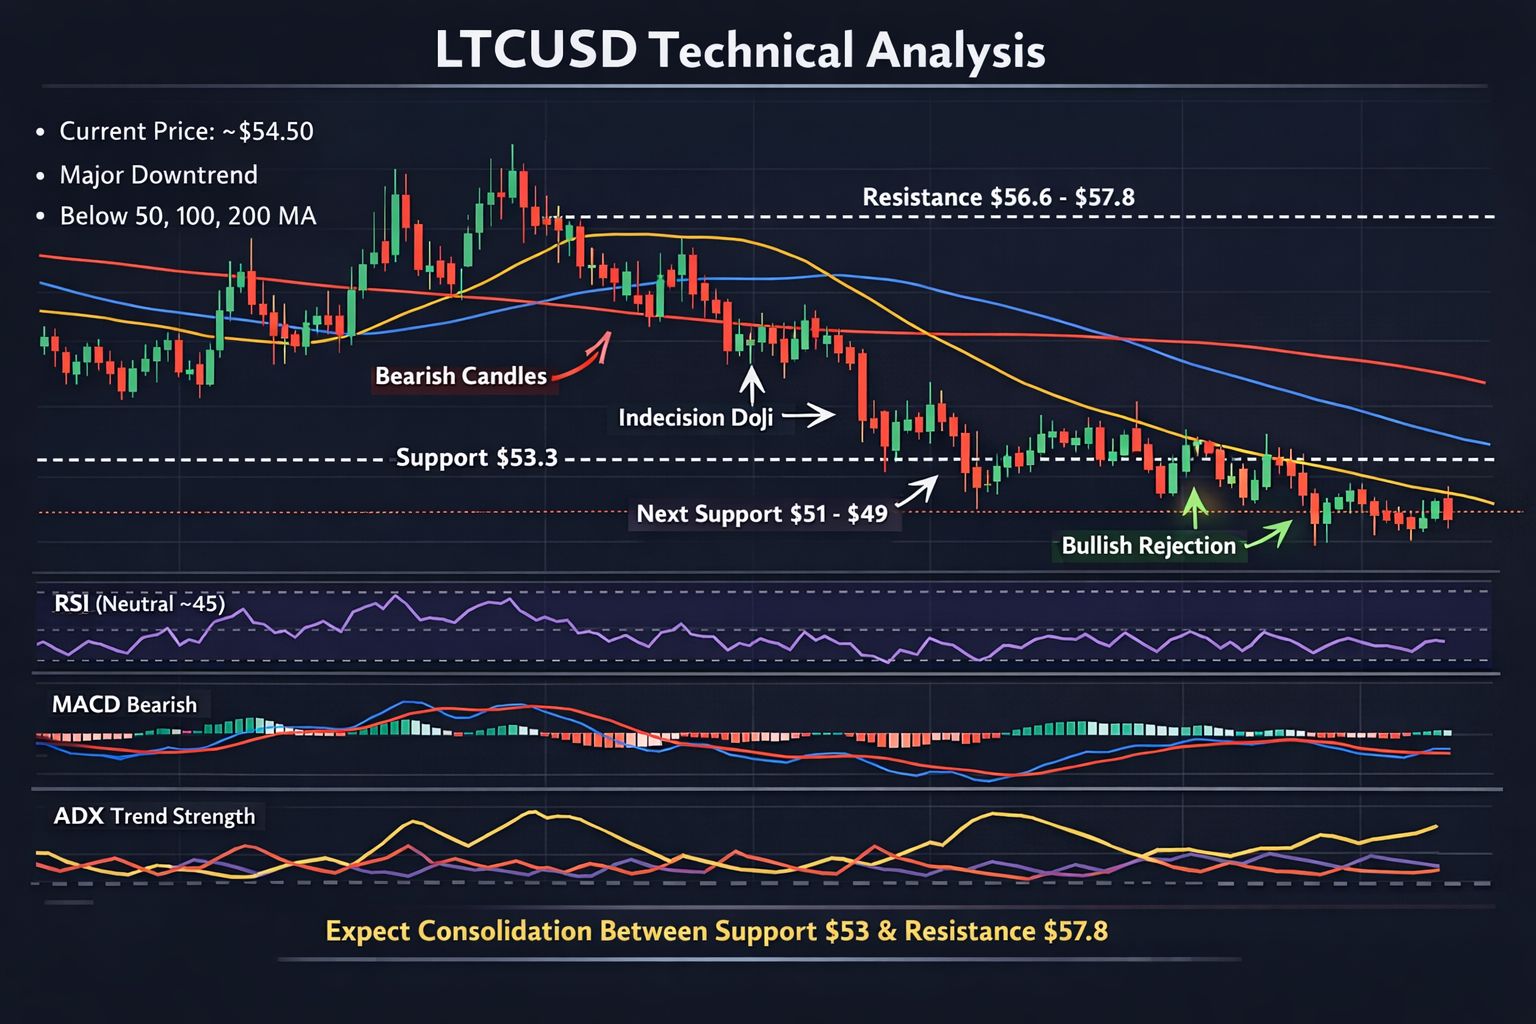
LTC obecnie handluje znacznie poniżej swoich 52-tygodniowych szczytów, pokazując długoterminowy niedźwiedzi trend w poziomach cenowych (ostatnio ~54–55 USD w porównaniu do szczytów bliskich ~140 USD). �
Barchart.com +1
Ruch cen poniżej głównych średnich kroczących (np. 20-, 50-, 100-, 200-okresowych) sugeruje dominację trendu spadkowego w wyższych ramach czasowych — tradycyjne terytorium niedźwiedzi.
📈 Struktura świec & interpretacja
Kiedy oglądasz LTCUSD na wykresie świec:
🔻 Niedźwiedzie świece
Długie czerwone ciała z małymi dolnymi knotami zazwyczaj wskazują na silną presję sprzedażową — niedźwiedzie pchające ceny w dół.
Wiele kolejnych niedźwiedzich świec formujących niższe minima & niższe maksima potwierdza kontynuację trendu spadkowego.
🔄 Niepewność & Konsolidacja
Świece Doji i małe świece (z górnymi i dolnymi knotami) reprezentują niepewność rynkową, często widoczną w pobliżu stref wsparcia, gdzie ani byki, ani niedźwiedzie nie dominują.
Kiedy te pojawiają się wokół poziomu wsparcia poziomego, często poprzedza to konsolidację lub próbę krótkoterminowego odwrócenia.
🔼 Odrzucenia bycze
Świece z długimi dolnymi cieniami (ogonami) pokazują odrzucenie niższych cen — kupujący wchodzą w pobliżu wsparcia. Jeśli potwierdzone przez zamknięcie następnej świecy wyżej, to sygnał byczy na krótki okres.
Ale chyba że jest to w pobliżu istotnego wyższego oporu i wspierane przez wolumen, może to prowadzić jedynie do tymczasowego odbicia.
📌 Kluczowe poziomy cenowe z danych wykresów
Typ poziomu
Cena (przybliżona)
Natychmiastowe wsparcie
~53.3 USD
Następne wsparcie
~51–49 USD
Krótkoterminowy opór
~56.6–57.8 USD
Głębszy opór
~60 USD+
Te poziomy pochodzą z typowych punktów swingowych świec i klastrów wsparcia/oporu widocznych w historii cen.
🧠 Wskaźniki-świecowe sygnały (kontekst)
RSI w okolicach neutralnych do lekko niedźwiedziej (poniżej 50) → wskazuje na osłabienie momentum, nie jest mocno wyprzedany — co oznacza, że niedźwiedzie mają jeszcze przestrzeń.
MACD niedźwiedzi i wskaźniki momentum trendują w dół → potwierdzają ruch cenowy widoczny w świecach dla trendu spadkowego.
ADX pokazujący siłę w obecnym trendzie → gdy ADX jest wysoki (powyżej ~25), sugeruje, że istniejący trend (niedźwiedzi) jest silny, nawet jeśli świece pokazują korekty. �$
📍 Co sugeruje wykres świecowy
Krótkoterminowe (intraday/dziennie):
Oczekuj ruchów w zakresie, chyba że pojawi się silna świeca przełamania z wolumenem — konsolidacja boczna między wsparciem ~53 a oporem ~57.
Średnioterminowe (dni/tygodnie):
Przełamania poniżej mocnych wsparć z niedźwiedziymi świecami (szerokie korpusy, zamknięcie w pobliżu minimów) mają tendencję do przyspieszania ruchów w dół.
Seria byczych świec odwrócenia (młotek/długie dolne cienie + potwierdzenie) w pobliżu wsparcia może prowadzić do odbicia, ale musi przełamać krótkoterminowy opór, aby oznaczyć zmianę trendu.
Długoterminowe (tygodnie+):
Dominujący trend spadkowy utrzymuje się, dopóki cena zdecydowanie nie zamknie się powyżej długoterminowych średnich kroczących (np. 50 i 200 okresów zamknięcia na wyższych ramach czasowych).
$ Notatki ryzyka
Analiza świec zyskuje na wiarygodności, gdy jest łączona z wolumenem i wskaźnikami momentum.
Rynki kryptowalut mogą być zmienne i podatne na fałszywe przełamania — zawsze rozważaj poziomy stop-loss.
#LTC/USD #Binance #StrategicMoves"