Here’s a clear technical outlook for SOL/USDT based on your chart:
📊 Solana (SOL) Analysis – Current Price: $91
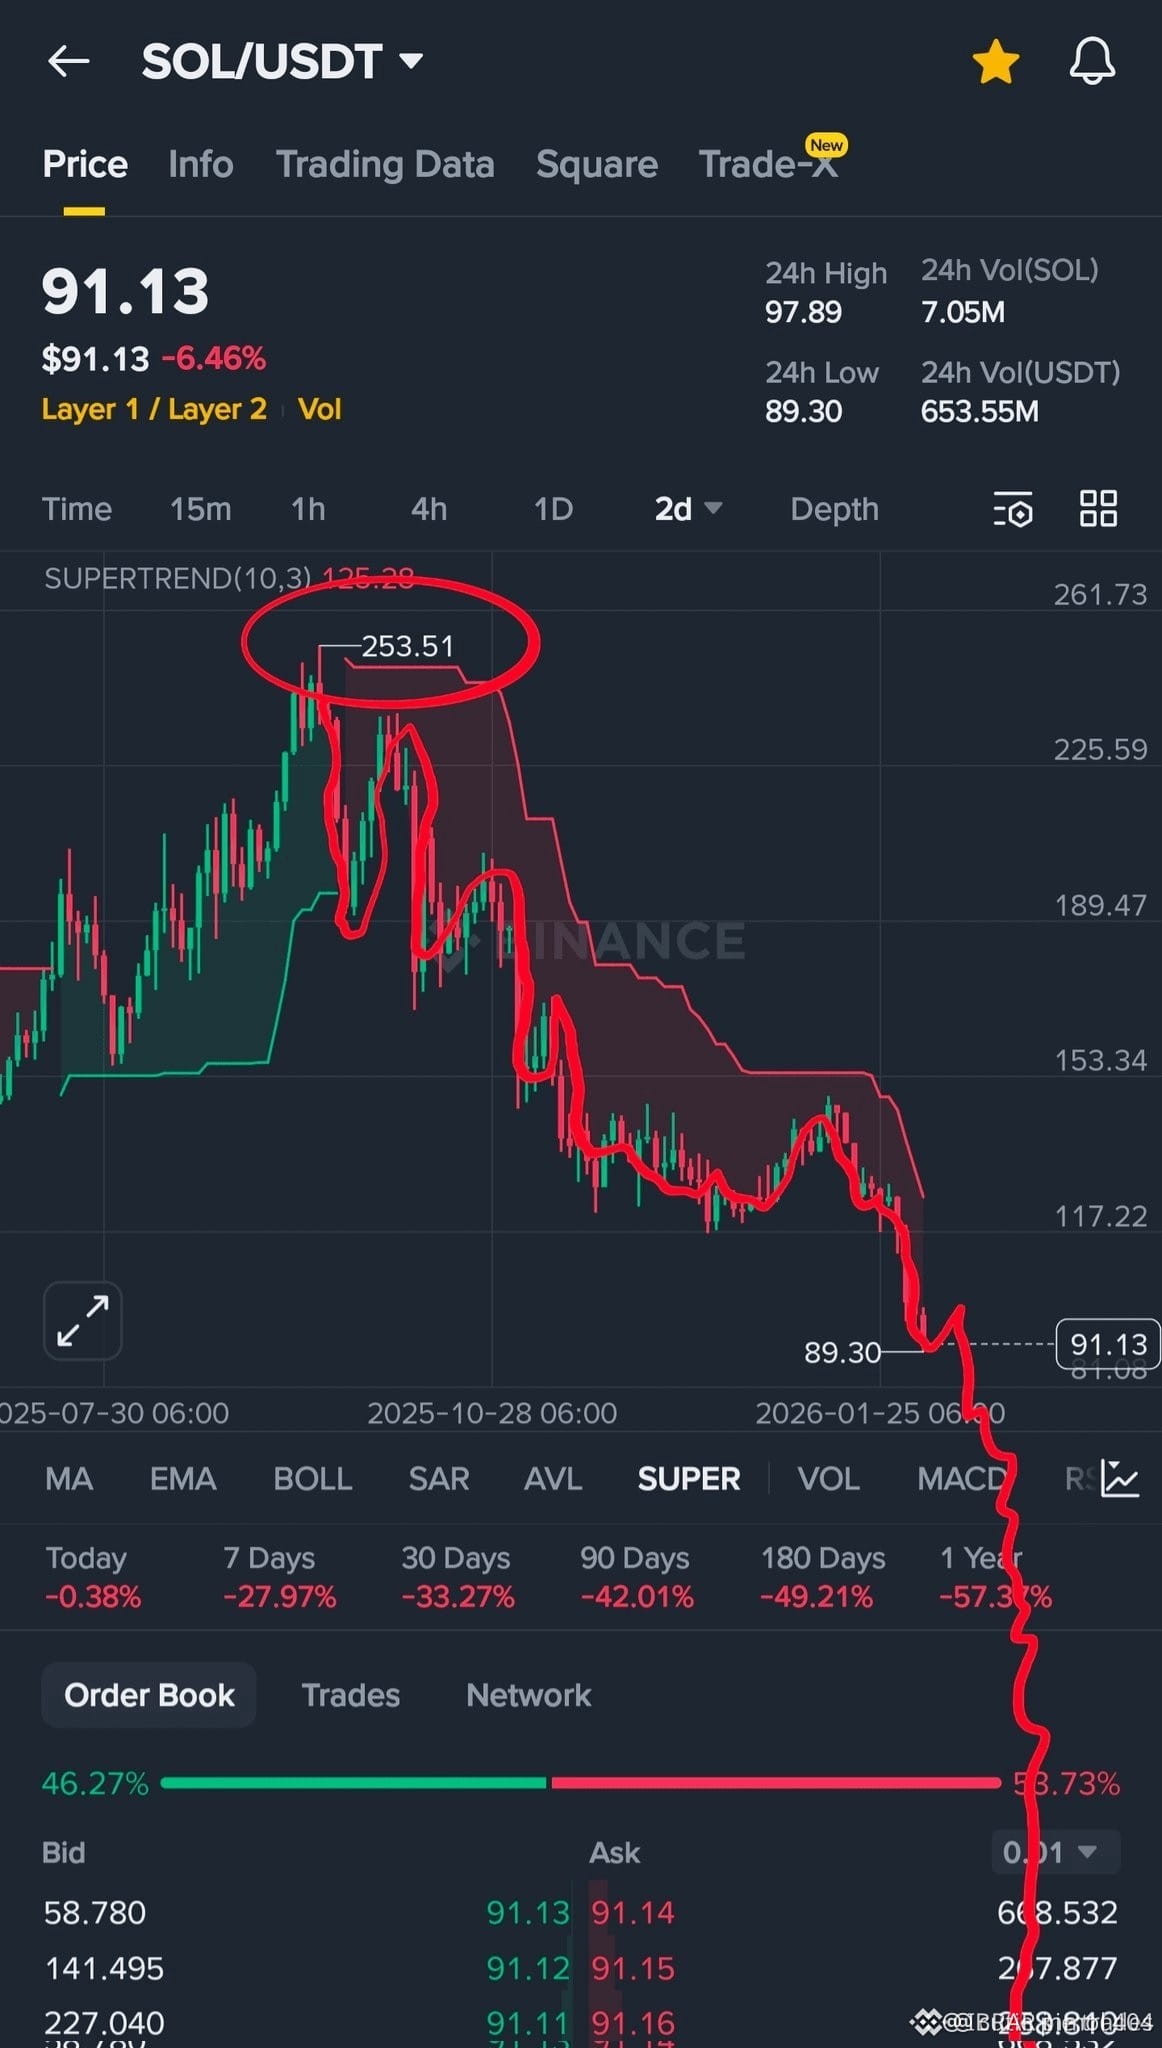
🔎 Market Structure
Previous major high: $253
Strong downtrend since that peak
Continuous lower highs & lower lows
Currently trading around $89–$92 support zone
The trend is clearly bearish on higher timeframes.
📉 Bearish Scenario (More Downside)
If SOL:
Breaks below $89 support
Closes strongly under $85
Then next possible targets:
$75
$65
Extreme panic zone: $50–$55
Momentum and structure currently favor sellers.
📈 Bullish Scenario (Relief Bounce)
For upside recovery:
SOL must reclaim $100
Then break and hold above $110
If that happens:
Short-term target: $120–$130
Strong reversal confirmation only above $150
Right now, any bounce looks like a relief rally inside a downtrend unless $110+ breaks.
📊 Indicators Overview (Based on Chart)
Supertrend shows bearish pressure
Lower volume on bounces (weak buying)
Strong rejection from previous resistance areas
🧠 Summary
🔴 Trend: Bearish
🟡 Current zone: Weak support
🟢 Real reversal only above $110–$150
At this moment, probability slightly favors sideways to downside unless strong buying enters.
⚠️ Crypto is volatile. This is technical analysis, not financial advice.
If you want, I can also create a clean visual projection chart showing bulli#USIsraelStrikeIran sh & bearish paths.sol#solana $