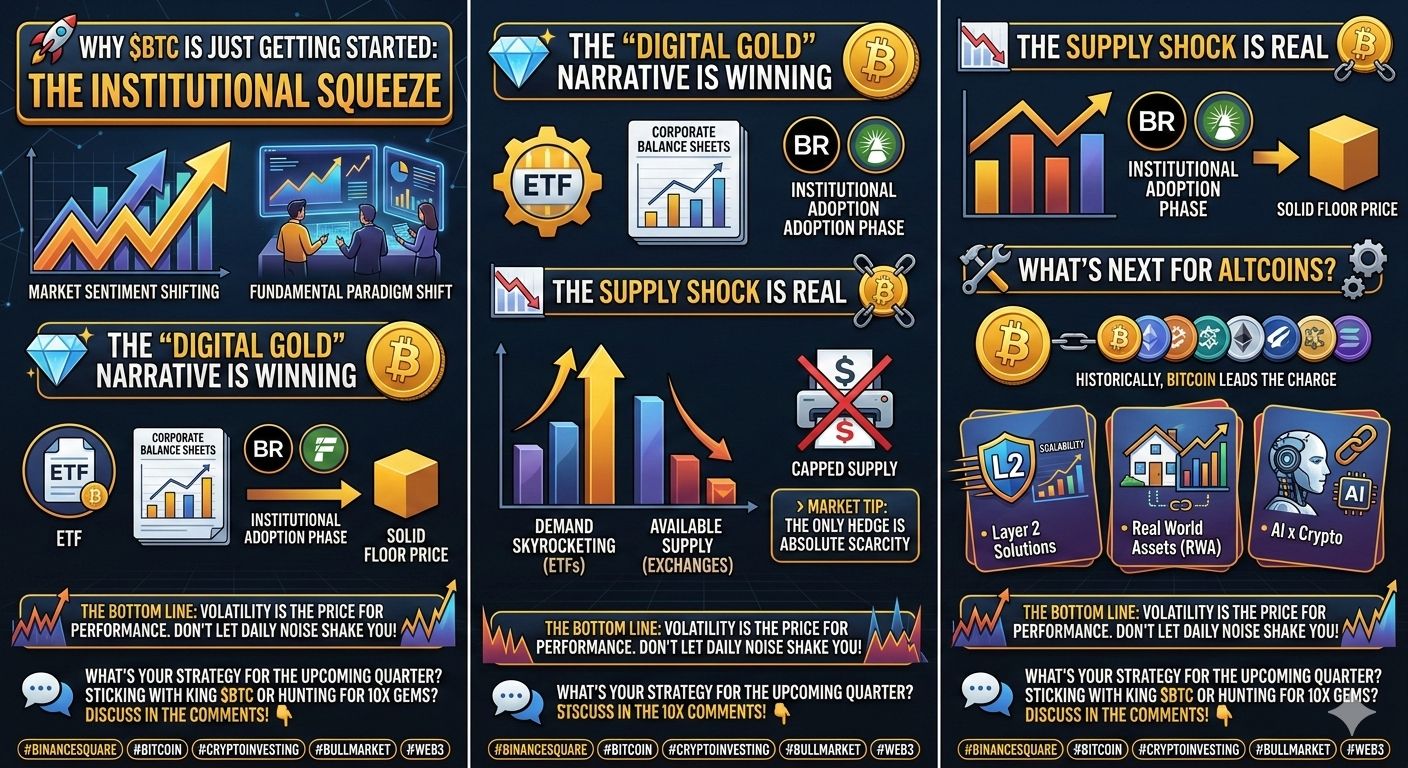
🚀 Why $BTC Is Just Getting Started: A Technical View of the Institutional Squeeze
The market sentiment is shifting, and for those watching the charts closely, it’s clear this is more than just another "pump and dump." We are witnessing a fundamental and technical paradigm shift in how the world values digital assets.
💎 The "Digital Gold" Narrative: A Technical Breakout
For years, $NVDAon Bitcoin was dismissed as a speculative bubble. Now, those same skeptics are leading the charge with Spot ETFs and corporate adoption. This massive shift, from retail speculation to institutional investment, isn't just about narratives; it's visible on the charts.
On the higher timeframes, Bitcoin has definitively broken out of long-term consolidation patterns. We've seen a clear breach of multi-year resistance zones, and what was once a ceiling is now solidifying as a strong support level. The moving averages (e.g., the 200-day SMA) are all sloping upward, confirming a robust, long-term bullish trend. The massive volume accompanying these breakouts confirms that this isn't a fluke; it's significant buying pressure.
📉 The Supply Shock is Real (and Quantifiable)
The classic supply-demand imbalance isn't just a theory; we can see it in on-chain data and the charts. While institutional demand via ETFs is skyrocketing, the liquid supply on exchanges is hitting historic lows. This creates a technical environment where any significant buying pressure leads to outsized price moves, as there are fewer coins available for sale. This "supply shock" is the engine driving the price discovery phase.
> Technical Insight: The combination of breaking long-term resistance and a shrinking liquid supply is a powerful bullish signal, suggesting that the path of least resistance for price is upward.
>
🛠️ The Technical Setup for Altcoins
Historically, the cycle begins with Bitcoin leading, followed by an "Altseason" once $BTC finds a stable consolidation range. From a technical perspective, we should watch for:
* Layer 2 Solutions: These protocols (e.g., Lightning Network, Stacks) are breaking technical barriers for scalability. Look for technical strength in L2 tokens, indicating that capital is moving to solutions that make the network more efficient.
* Real World Assets (RWA): The trend of tokenizing traditional assets (real estate, stocks) is technically nascent but has immense long-term potential. Watch for breakout patterns in tokens associated with strong RWA platforms.
* AI x Crypto$GOOGLon : The convergence of AI and decentralized networks is creating powerful new use cases. Look for projects with clear utility and strong technical chart setups, as this is a narrative with substantial tailwinds.
The Bottom Line: Volatility is inherent to price discovery. Short-term corrections are opportunities for consolidation, not reversal signals, as long as key support levels (like the prior cycles’ all-time high) hold. Don't let the noise of lower timeframe charts shake you out of a generational, macro-trend position.
📊 Let's Talk Strategy
What is your technical perspective on the current market?
* Sticking with the King ($GOOGLon $BTC): Do you think $BTC dominates until key resistance levels are hit?
* Hunting for Altcoin Gems: Are you seeing breakout patterns in specific L2, RWA, or AI tokens?
#BinanceSquare #Bitcoin #TechnicalAnalysis #ChartPatterns #Bul
lMarket #Web3 #lMarket #Web3 #Altcoins