$DOGE 📉 Przegląd aktualnej ceny
Na podstawie najnowszych danych (luty 2026), Dogecoin jest notowany w okolicy $0.093–$0.095 na głównych giełdach, z kapitalizacją rynkową bliską $15.8 B i umiarkowanym wolumenem handlu (24 h). �
CoinMarketCap
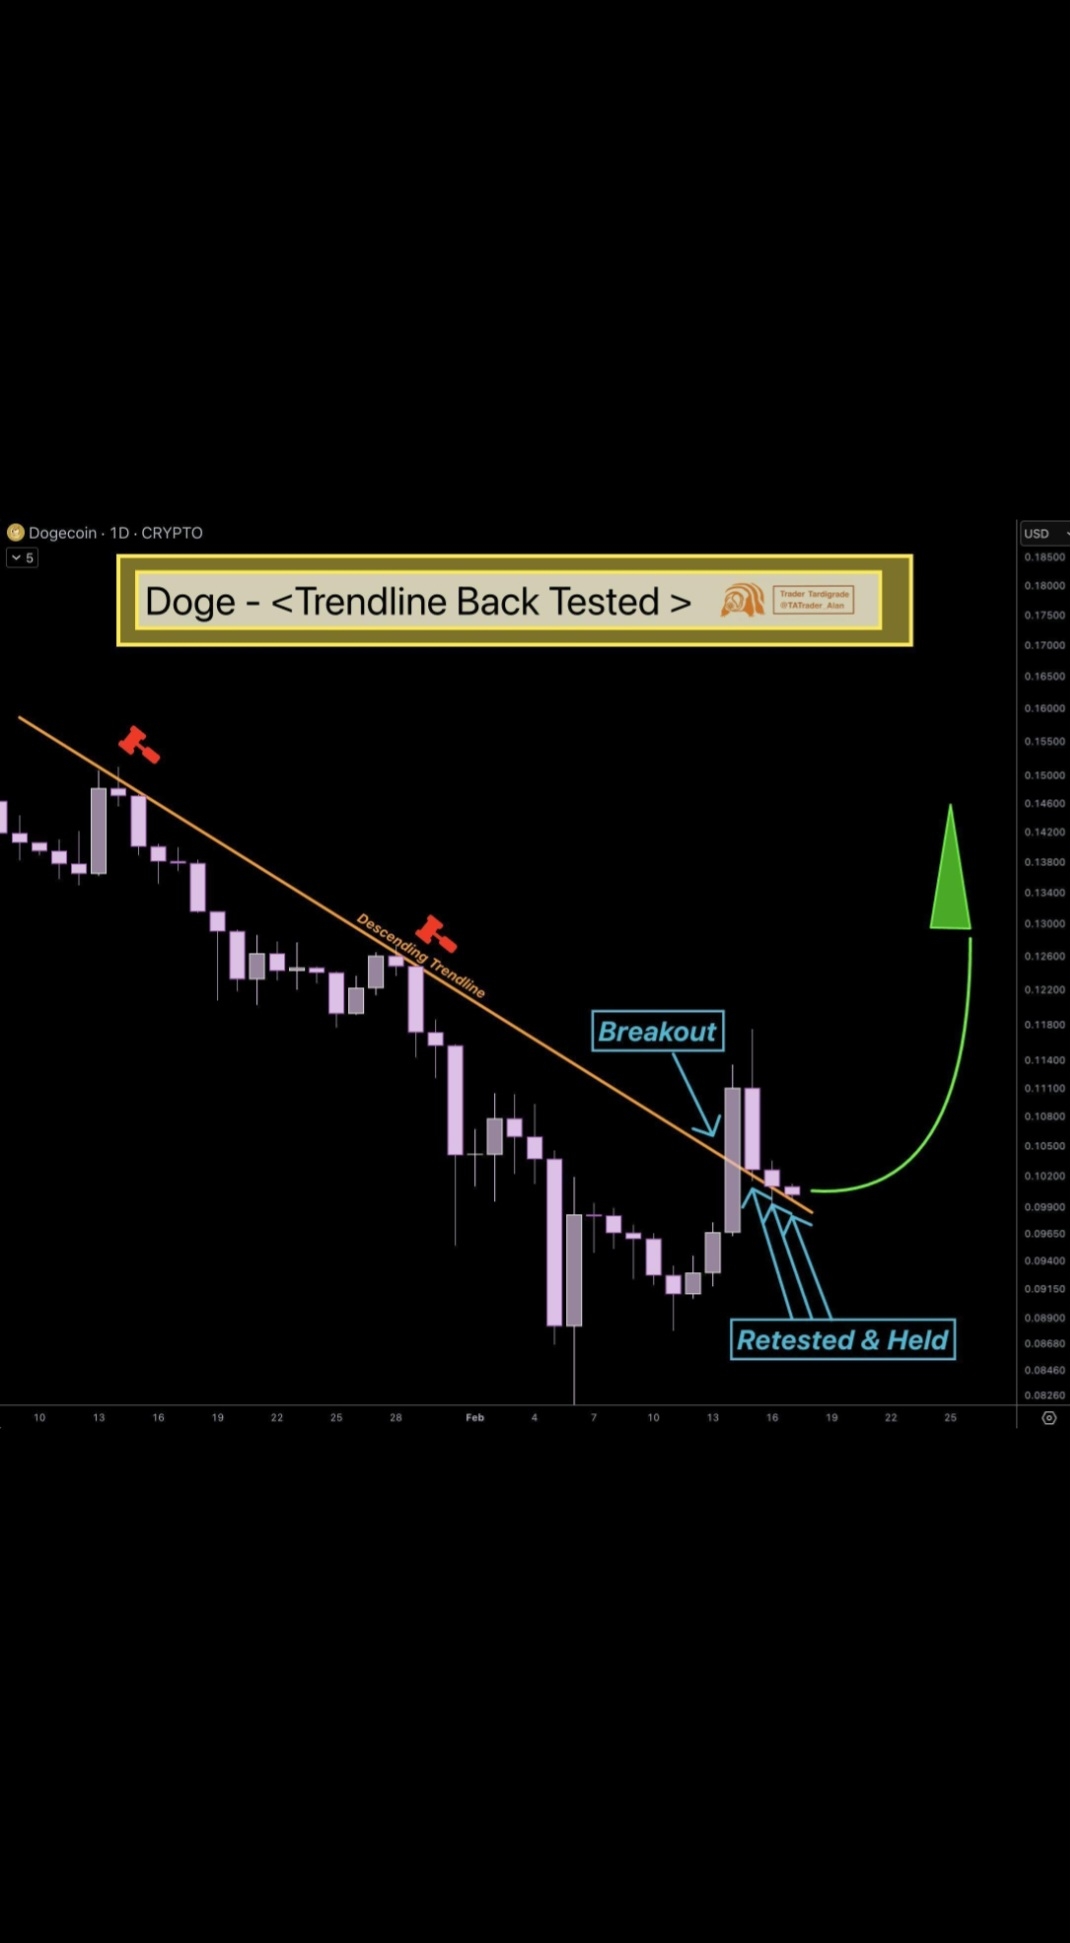
To powoduje, że bieżące świece na wykresie dziennym pokazują odbicie w dolnym zakresie po okresie presji sprzedażowej — cena porusza się bocznie blisko kluczowego wsparcia (około $0.09) po wcześniejszej zmienności. �
🕯️ Wzory świecowe i co sugerują
1. Odbicie z poziomu wsparcia w stanie wyprzedania
Niedawne dzienne świece utworzyły długie dolne knoty blisko ~$0.087–$0.093, wskazując, że nabywcy wkraczają w ten obszar wsparcia.
Warunki przeszacowania (np. RSI na głębokim dole) pokazują odrzucenie ceny blisko podłogi — byczy wzór odrzucenia często widoczny przed tymczasowymi ruchami wzrostowymi.
2. Konsolidacja między poziomami
Świece DOGE nie mają silnej kontynuacji trendu i handlują w wąskim poziomym zakresie — to znak niepewności między bykami a niedźwiedziami.
Ruch cenowy wydaje się być ograniczony w zakresie, a nie w trendzie, z oporem powyżej i wieloma świecami zamykającymi się w pasmie.
3. Potencjalne odwrócenie lub kontynuacja?
Świece dzienne obecnie odzwierciedlają boczny rynek: małe ciała i częste testowanie wsparcia.
Zwykle poprzedza to wybicie powyżej oporu lub załamanie, jeśli wsparcie zawiedzie — traderzy obserwują świece potwierdzające wybicie.
4. Dłuższy kontekst tygodniowy
Skupisko świec tygodniowych kompresuje się między głównym wsparciem a średnimi, z wielokrotnymi testami górnych/dolnych cieni. To pokazuje testowanie równowagi przez rynek.
Cena pozostaje poniżej kluczowych długoterminowych średnich kroczących (20-tygodniowa, 50-tygodniowa, 100-tygodniowa), które nadal działają jako opór powyżej.
📊 Co oznaczają sygnały świec?
Bycze sygnały (krótkie odbicie reliefowe):
Długie dolne knoty blisko kluczowego wsparcia — nabywcy bronią niższych cen.
Okazjonalne silne bycze zamknięcia dzienne, gdy wolumen wzrasta.
Neutralne/Sygnały niepewności:
Świece z małymi ciałami i długimi knotami po obu stronach → niepewność.
Przedłużający się zakres; brak trwałego wybicia powyżej oporu.
Niedźwiedzie rozważania:
Cena poniżej krytycznych długoterminowych średnich kroczących — trend nadal jest płaski lub niedźwiedzi.
Niepowodzenie w przełamaniu niedawnego oporu konsolidacyjnego sprawiłoby, że sprzedawcy czuliby się komfortowo.
📌 Podsumowanie
📍 Krótkoterminowy (dni/tygodnie):
Świece DOGE pokazują odbicie z przeszacowanego obszaru wsparcia — potencjał na mały wzrost, jeśli nabywcy nadal będą bronić ~$0.09. Obserwuj silne zielone dzienne świece zamykające się powyżej niedawnych minimów i krótkiego oporu, aby potwierdzić momentum.
📍 Średnioterminowy:
Bez świecy wybicia powyżej głównych stref oporu (w okolicach poprzednich szczytów lub średnich kroczących), trend pozostaje boczny lub niedźwiedzi. Potwierdzenia wymagają wolumenu + zamknięcia powyżej poziomów oporu.
📍 Kluczowe poziomy do obserwacji (na podstawie wykresu):
Strefa wsparcia: ~$0.087–$0.093
Opór: Następne istotne zamknięcie powyżej ~$0.1015 może wywołać dalszy wzrost.

#USIsraelStrikeIran #MarketRebound #Dogecoin