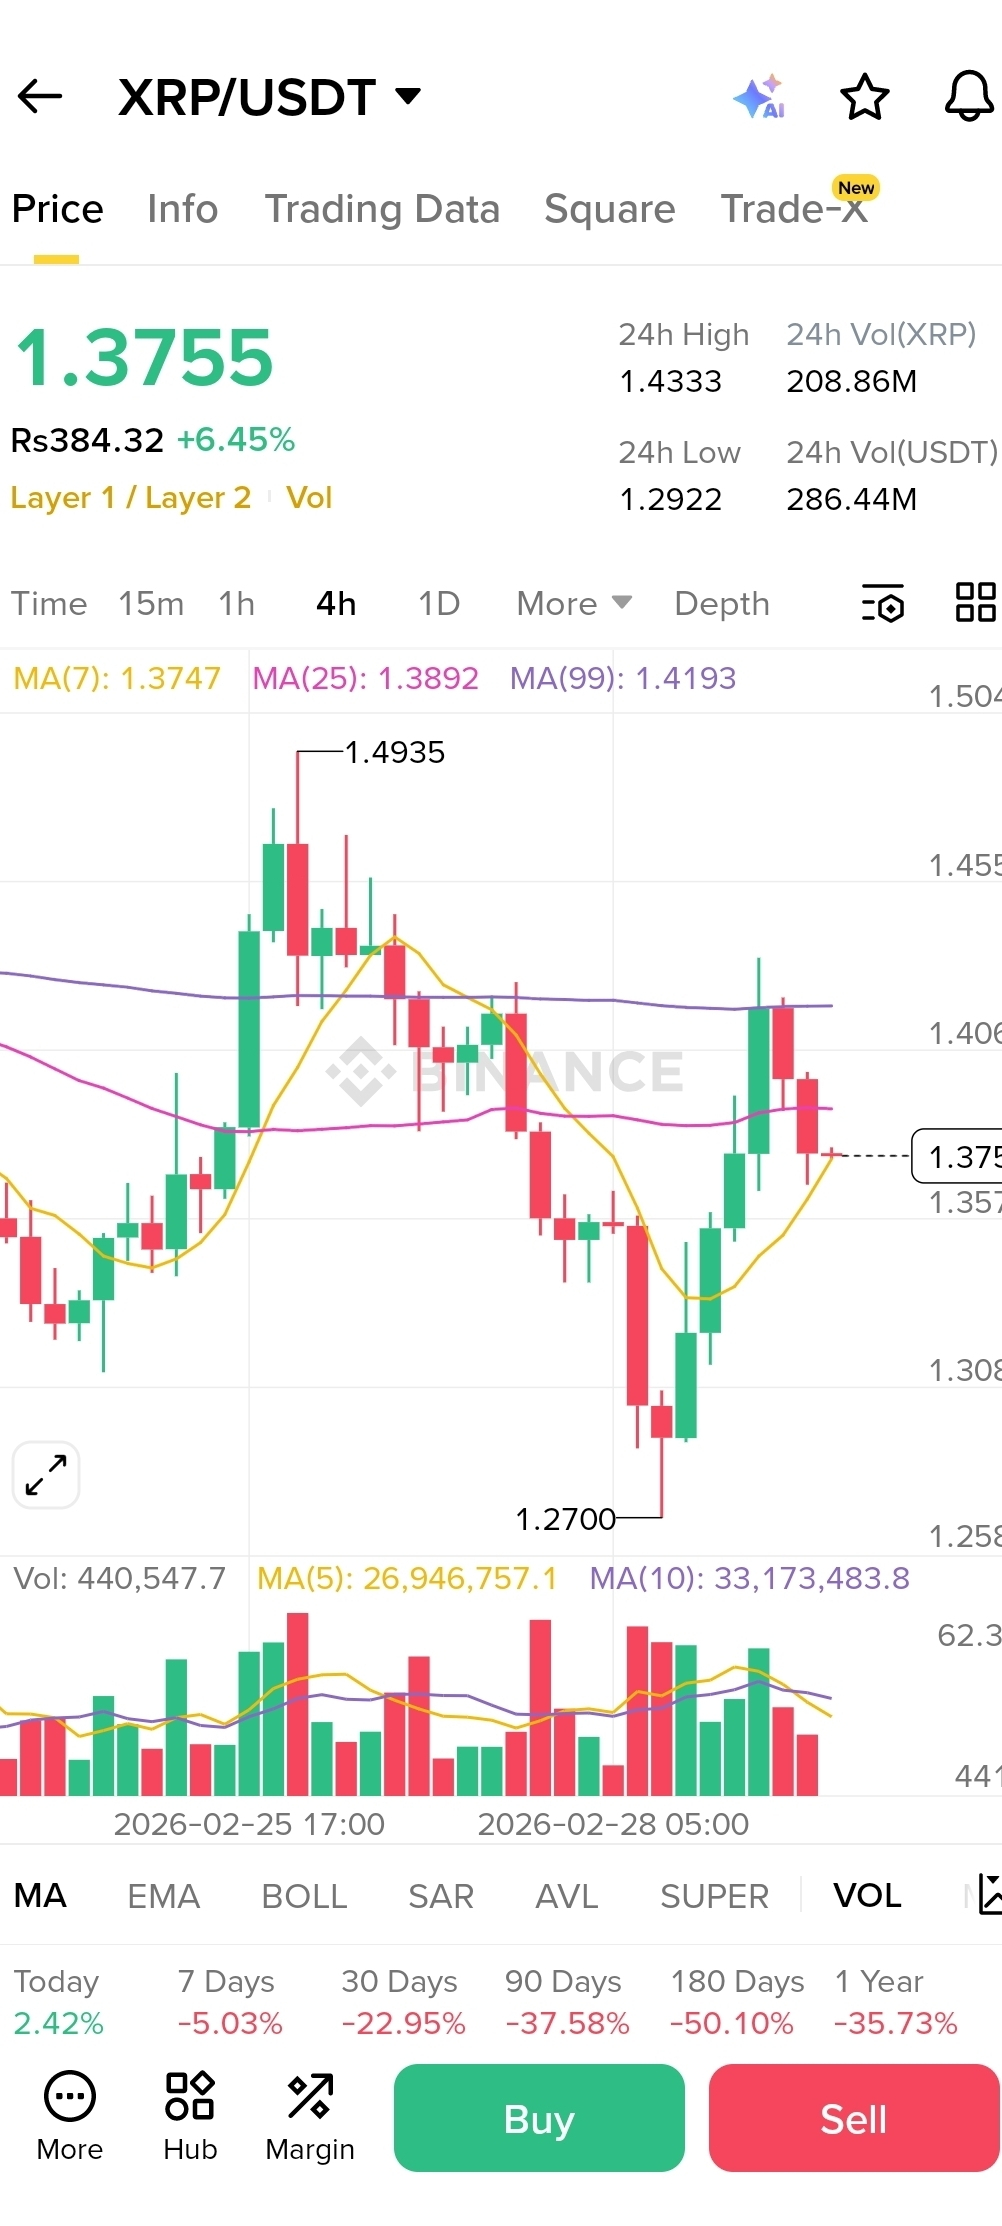
The 4-hour chart of XRP/USDT shows a market trying to regain balance after a sharp decline. Price is currently trading near 1.3755, reflecting a modest recovery from recent lows. Over the last 24 hours, the asset has moved between 1.2922 and 1.4333, highlighting active participation and short-term volatility.
A few sessions ago, the chart recorded a strong upward push toward the 1.49 area. That move, however, could not sustain momentum. Sellers stepped in near that level, and price gradually pulled back. The decline eventually extended to around 1.27, where buyers began to respond. This reaction suggests that demand emerged at lower levels, creating a short-term support zone.
From a technical perspective, the moving averages offer useful context. The shorter moving average (MA7) is hovering close to the current price, showing that momentum has stabilized in the near term. The MA25 sits slightly above, acting as a mild resistance level. The MA99 remains higher still, indicating that the broader trend has not fully shifted upward. When price trades below longer-term averages, it often signals that recovery is still in progress rather than complete.
Volume patterns also deserve attention. The selloff toward 1.27 was accompanied by strong volume, which typically reflects decisive market activity. The recent rebound has also shown healthy participation, though not as aggressive as the earlier drop. This suggests buyers are present, but conviction is still developing.
In summary, the chart reflects a market in transition. After a notable decline, price has found short-term support and is attempting to rebuild structure. Resistance levels overhead may continue to test upward momentum, while support below will remain important for maintaining stability. As always, price behavior around these key zones will shape the next phase of movement.