XRP trades around $1.38 with the near-term bias mildly bearish. The price holds well below the 50, 100, and 200-day Exponential Moving Averages (EMAs), which are clustered between $1.62 and $2.06. All three moving averages are sloping lower, keeping the broader trend under pressure despite the recent bounce from a weekly low at $1.31.
The Moving Average Convergence Divergence (MACD) indicator holds above its signal line on the daily chart, while the green histogram bars are contracting, suggesting a modest bullish influence within a larger downtrend.
Still, the Relative Strength Index (RSI) around 40 remains below the neutral 50 line on the same chart, indicating oversold conditions and reinforcing downside momentum toward support at $1.31.
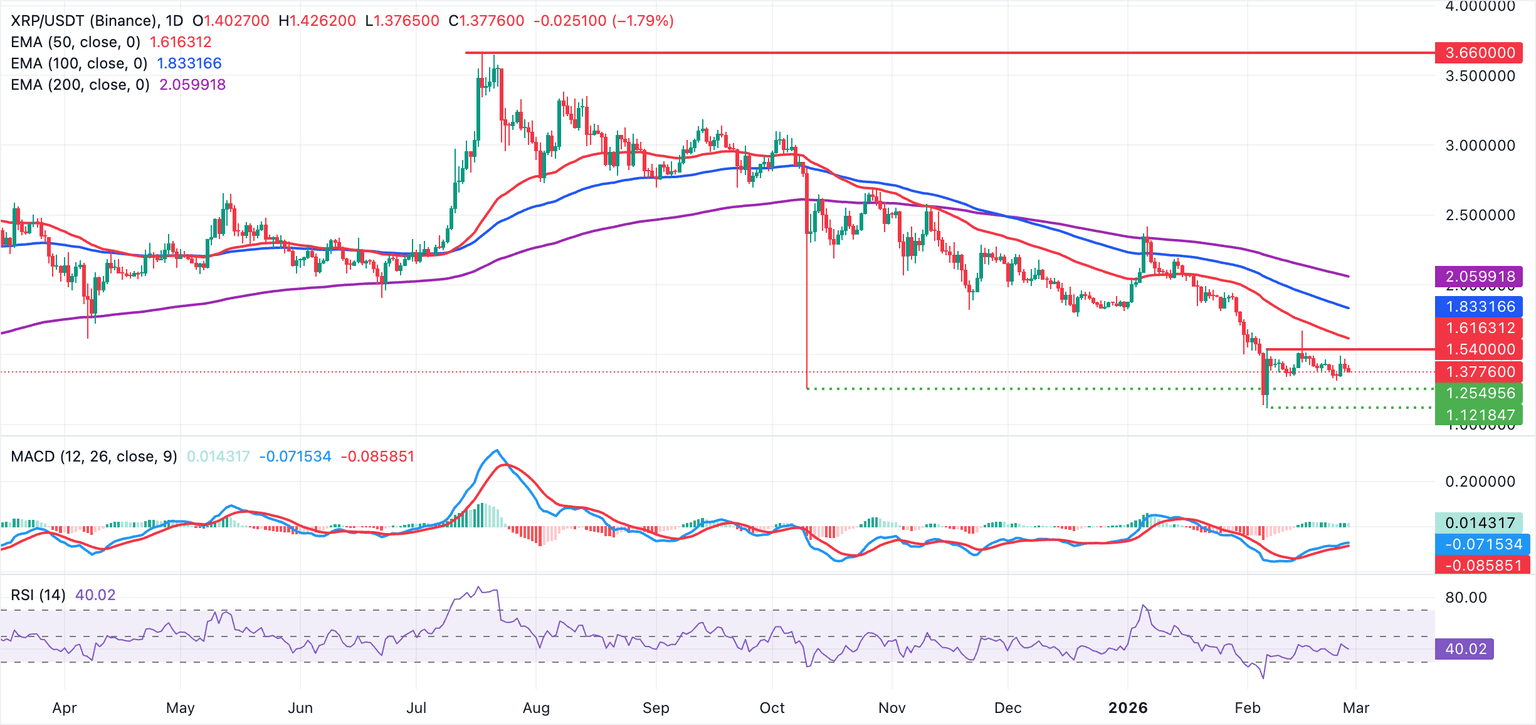
#Initial resistance emerges at $1.54, aligning with the February 6 high, while the 50-day EMA lines up to cap rebounds at $1.62. A break above this supply cluster could open the door to a larger breakout targeting the 100-day EMA at $1.83 and later the 200-day EMA at $2.06.
#IranConfirmsKhameneiIsDead #BitcoinGoogleSearchesSurge #RippleRumblings