A recent price change distribution snapshot reveals a sharply negative market breadth, with declining assets overwhelmingly outnumbering advancers. The data highlights a trading session where selling pressure dominated across nearly all performance brackets.
Downward Moves Far Outpace Gains
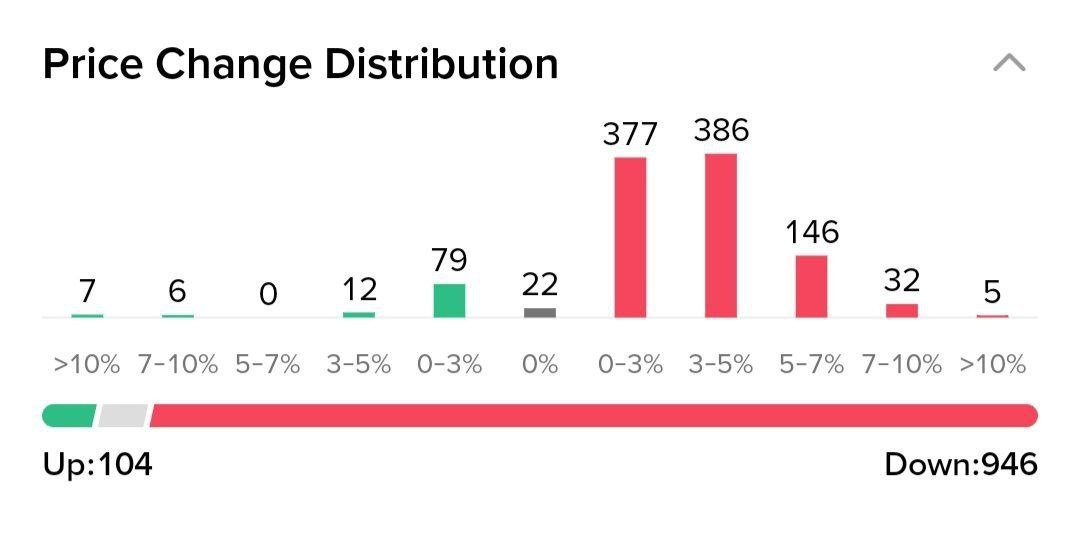
According to the distribution chart:
Up: 104
Down: 946
This means roughly nine times as many assets closed lower than higher, signaling broad-based weakness rather than isolated pullbacks in specific sectors.
The visual breakdown shows that only a small fraction of assets posted gains across performance ranges such as 0–3%, 3–5%, and above 10%. In contrast, the majority of activity clustered in negative territory.
Heavy Concentration in Moderate Declines
The largest concentrations of price movement appear in the 0–3% and 3–5% decline categories, with particularly elevated counts in those ranges. This suggests widespread but moderate selling rather than extreme panic-driven drops.
Notably:
The 0–3% decline bracket shows one of the highest counts.
The 3–5% decline bracket closely follows.
Even the 5–7% and 7–10% ranges reflect significant downside participation.
Meanwhile, very few assets posted gains exceeding 5%, and almost none registered double-digit advances.
What This Indicates About Market Sentiment
Such a skewed distribution often reflects:
Risk-off sentiment
Broad sector weakness
Institutional de-risking
Macro-driven pressure
When market breadth deteriorates to this extent, it signals that selling is not limited to a single industry or asset class. Instead, it suggests a systemic wave of caution or repositioning.
However, it is also important to distinguish between broad mild declines and extreme capitulation. The concentration in the lower decline brackets (0–5%) implies controlled selling rather than panic liquidation.
Short-Term Pressure, Longer-Term Implications
Market breadth indicators like this are frequently used by traders and analysts to gauge underlying strength or weakness beyond headline index performance. Even if major indexes show moderate declines, a 946-to-104 down-to-up ratio points to significant internal weakness.
Historically, extreme breadth readings can either:
Signal continuation of downside momentum, or
Mark exhaustion points that precede short-term rebounds
Context matters — including volume, macroeconomic conditions, and upcoming catalysts.
Conclusion
The price change distribution reflects a session dominated by sellers, with declines vastly outnumbering advances. While most losses appear moderate rather than extreme, the breadth imbalance underscores a clear risk-off environment.
Whether this represents the start of a deeper correction or a temporary wave of selling pressure will depend on follow-through in upcoming sessions. For now, the data paints a picture of cautious markets and widespread downside participation.
👍👍👍 If you follow me then you will get back 💯% 👍👍👍


#altcoins #BearMarke #BullRunTips #Binance #CryptoTradingInsights