Take a step back and look at Bitcoin’s history for a minute. You’ll notice something: those big drops everyone freaks out about? They’re not flaws. They’re part of the design.
If you’re teaching people about crypto or helping traders make sense of the chaos, knowing how Bitcoin tends to drop—and then claw its way back—gives you way more perspective than just staring at the daily price swings.
Let’s keep things simple and get right to it.
🔻 What’s a Bitcoin Correction, Anyway?
A correction is when Bitcoin drops 10% to 30% from a recent high, but the overall trend is still up. It’s a breather, not a collapse.
A bear market’s a whole different beast. Think 50%+ drops, months (or even years) of sliding prices, and the entire mood around crypto flips.
Bitcoin’s gone through both. A lot.
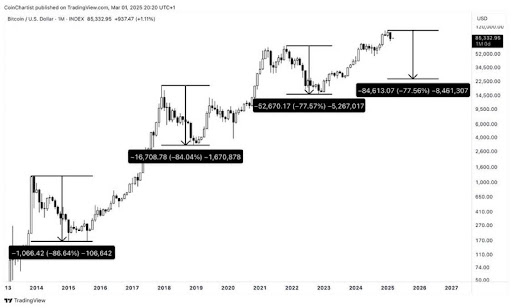
📊 A Quick Look at Bitcoin’s Past Corrections
🟠 2013 Bull Market
- Saw a bunch of 20–40% pullbacks
- Usually bounced back in a few weeks
- Volatility was wild
🔵 2017 Bull Run
- Six major corrections, each dropping 25–40%
- Every time, it hit new highs after
- Topped out near $20K, then crashed 80% into a brutal bear market
🟣 2020–2021 Cycle
- March 2020: about a 50% plunge (COVID panic)
- Several 30%+ drops on the way up to $64K
- A 55% drop in mid-2021
- Still managed to rally to a new all-time high near $69K
🟡 2022 Bear Market
- Crashed nearly 77% from the peak
- Spent ages chopping sideways
- Barely moved for a while before showing signs of life again
⏳ How Long Does It Take to Recover?
Here’s what history shows:
- Drops of 10–20%: Usually back on track in days or weeks
- Drops of 20–40%: Takes a few weeks to a couple months
- Drops over 50%: Could take months, sometimes even years
But here’s the real secret: Recovery speed isn’t just about chart patterns. Macro trends, halving cycles, and how the market’s structured all play a huge role.
🔄 The Halving: The Big Timer
Every four years, Bitcoin cuts the new supply miners get in half. That event often kicks off a major rally.
Right after a halving, you usually get:
- Strong bull runs
- Some nasty corrections in the middle
- A wild, parabolic finish
Those rough corrections during post-halving rallies? They usually wipe out the traders who are too greedy with leverage, then the price keeps climbing.
🧠 Why Do These Corrections Happen?
1. Too many traders using crazy leverage
2. People locking in profits at big psychological price levels
3. Macro shocks—think interest rate hikes, news about wars, big shifts in liquidity
4. Big swings in ETF flows
5. Miners selling off their coins
What’s the result? Funding rates reset, and the speculators who can’t handle the heat get washed out.
📈 Patterns Every Trader Should Notice
1️⃣ Bitcoin never just goes straight up (or down). Even in the strongest bull runs, it takes some nasty dives.
2️⃣ Zoom out. If the big trend still shows higher highs and higher lows, these corrections are usually just a pit stop.
3️⃣ After a big drop, Bitcoin tends to chill out and move sideways before the next big move starts.
🎯 Tips for Traders and Educators
- Focus on the percent drop, not just the dollar amount
- Compare what’s happening now to how previous cycles played out
- Watch on-chain data during corrections
- Keep an eye on funding rates and how much leverage is in the system
Corrections are the spots where long-term holders buy more, the weak hands give up, and the whole market structure gets reset.
So far, every major correction within a long-term Bitcoin uptrend has:
✔ Bounced back
✔ Broken past old highs
✔ Started a whole new narrative
But don’t get cocky. Just because it’s happened before doesn’t mean it’s guaranteed next time. Macro conditions change, and so do market rules.
Final Thought
Patience pays in Bitcoin. Always has.
What actually gets rewarded? Conviction. Good risk management. Knowing how the cycles work.
If you’re building crypto guides or trading tips, don’t call every correction a “crash.” Show people why they’re a normal, even healthy, part of the journey.