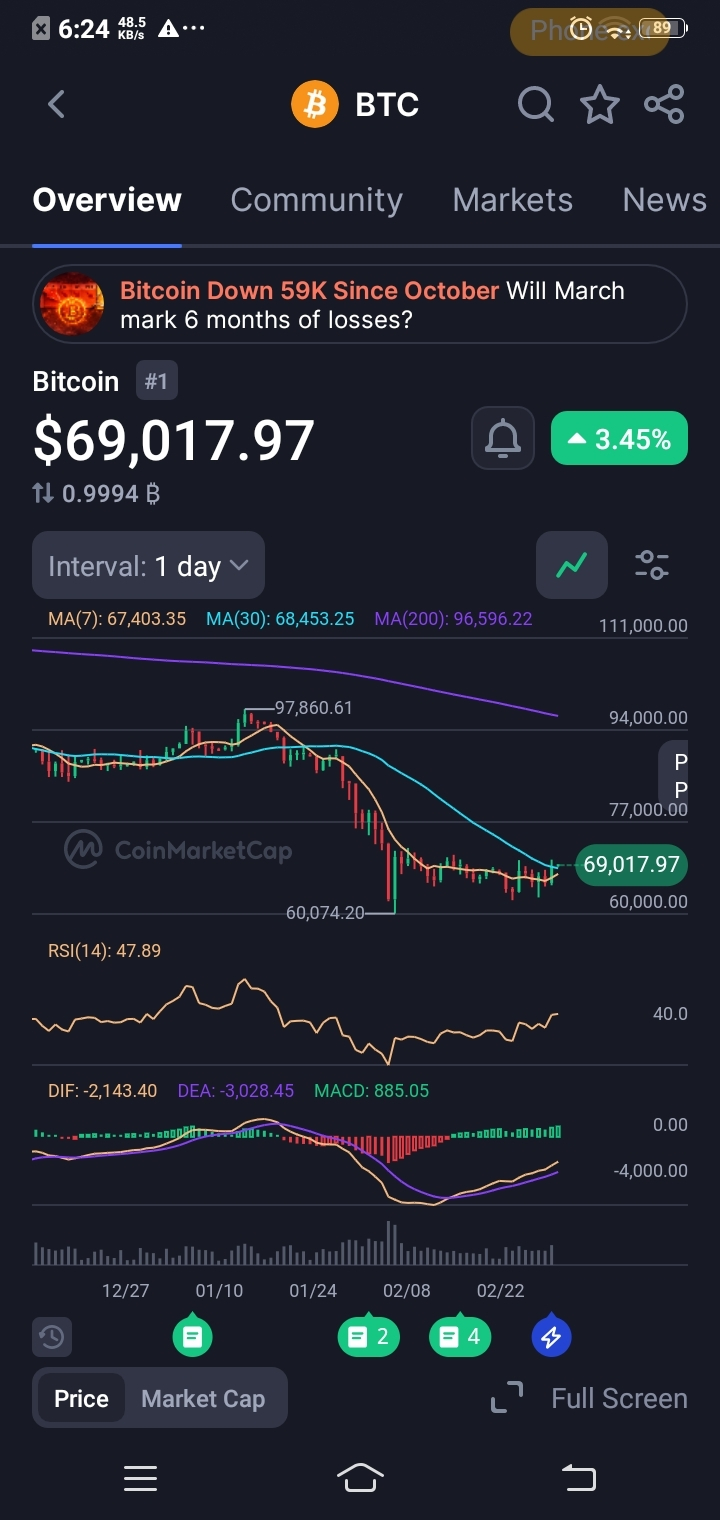
$BTC is currently trading near $69,000, but the landscape tells a story of compression. After the sharp drop from highs above $96K, price has been chopping sideways. The 7-day MA sits slightly below price, while the 30-day MA hovers just overhead at $68,453, creating a tight range. Crucially, the 200-day MA is far above at $96,596, confirming we are still technically in a long-term downtrend correction.
<1> Key Levels to Watch
The immediate battleground is between the $67,400 support (7 MA) and the $70,000 resistance zone.
Support: A break below $67,000 could open the door to retest recent lows.
Resistance: reclaiming $70,000 is the first step toward changing momentum.
Momentum: RSI at 47.89 shows neutral momentum—no one is in control yet. However, the MACD is showing a slight bullish cross, hinting that selling pressure may be exhausting.
<2> Possible Scenario
If $BITCOIN holds above the 7 MA and pushes through $70,000, we could see a relief bounce toward the $74,000–$77,000 range.
However, if price loses the $67,000 support zone, the next leg down toward the yearly lows could accelerate.
Invalidation: The bearish outlook is invalidated if we close a daily candle firmly above $71,500.
<3> Risk Warning
We are in a fragile macro structure. Six months of losses are rare, and while the market looks oversold, capitulation events can happen without warning. Manage your risk accordingly.
Stay patient and stick to your levels, not your emotions.