Real Trading Example: Bitcoin (BTC/USD) in 2023 Bull Run Continuation
A classic real-world case occurred in Bitcoin after its 2022 bear market bottom.
• Impulse move (Point 1 to Point 2): BTC rallied strongly from ~$16,000 (swing low) to ~$31,000 (initial high/swing high) in early 2023.
• Pullback (retracement to Point 3): Price corrected down to around $25,000–$26,000 (often near the 50%–61.8% retracement zone from the prior larger cycle, but focusing on this leg).
• Traders drew Fibonacci extensions using: Point 1 ($16k low), Point 2 ($31k high), Point 3 (~$25k pullback low).
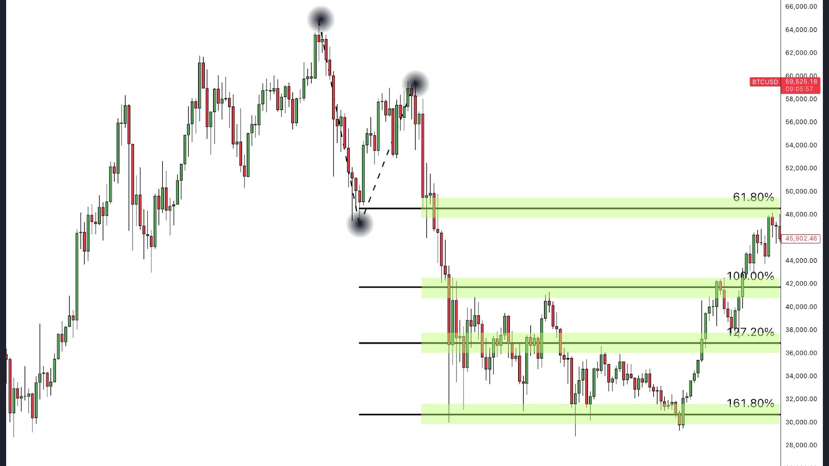
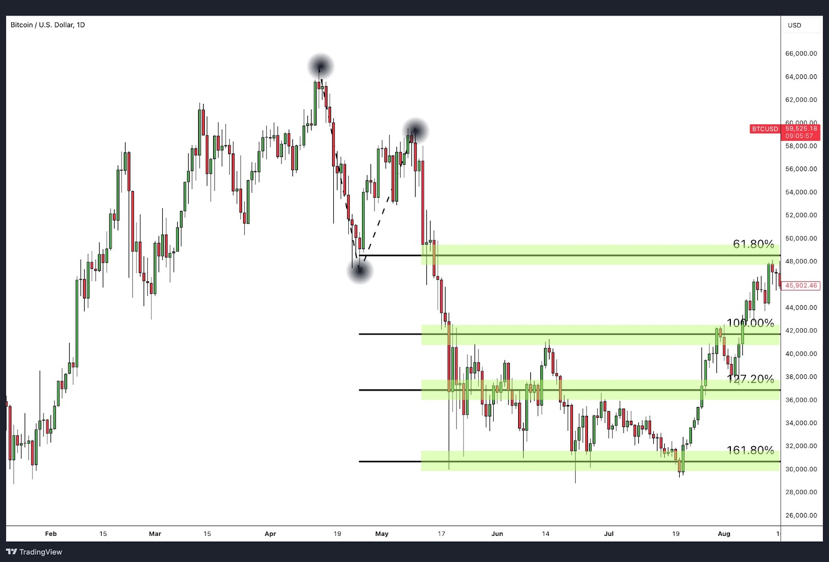
Projected targets:
• 100% extension → ~$40,000 (equal to the measured move length).
• 127.2% extension → around $42,000–$43,000.
• 161.8% extension (golden ratio target) → hit near $45,000–$48,000 in mid-2023, where many took partial profits as momentum slowed
Trade setup:
• Entered long near the pullback low (~$25k–$26k) with bullish confirmation (e.g., hammer candle or engulfing pattern + volume increase).
• Stop-loss below the swing low (~$24k for risk control).
• Partial exits: Scaled out at 100% (~$40k), more at 127.2%, and major profits at 161.8% (~$45k+), as price often stalls/reverses there.
This extension caught the next leg up perfectly before a deeper correction — a high-probability trend-continuation play.
Another quick example (S&P 500 or EUR/USD trends): In strong uptrends, after pullbacks to 50%–61.8% retracement, extensions frequently nail targets at 161.8% (e.g., Bitcoin’s 2021 run or recent gold moves stalled precisely at 161.8% extensions).
Key takeaway: Extensions shine in trending markets for setting realistic profit targets. Always confirm with candlestick patterns (like bullish engulfing at entry), volume, and confluence (e.g., prior resistance turned support). Risk management is crucial — never assume the target will be hit exactly!#Binance #Write2Earn #Write2Earn! #TrendingTopic