Detailed Fibonacci Retracement Example: Bitcoin (BTC/USD) in Early 2024 Post-Halving Rally
A strong real-world case from early 2024 shows how Fibonacci retracements identified a high-probability buy zone during Bitcoin’s bull run after the April halving.
• Impulse move (uptrend leg): BTC surged from a swing low of ~$42,000 (mid-January/early 2024 consolidation low) to a swing high of ~$58,800 (pre-correction peak in March/April timeframe).
• Price range of the move: $58,800 – $42,000 = $16,800 gain.
• Draw the Fibonacci retracement tool: Anchor from swing low ($42,000 = 0%) to swing high ($58,800 = 100%). The tool plots horizontal levels downward for potential support during the pullback.
Calculated key retracement levels:
• 23.6% → ~$55,800 (shallow pullback, often ignored in strong trends).
• 38.2% → ~$52,400 (moderate support, common in healthy corrections).
• 50% → ~$50,400 (psychological halfway point, widely watched).
• 61.8% (golden ratio, strongest level) → ~$48,400 (deep but high-probability reversal zone).
78.6% → ~$45,000 (deeper correction, risk of trend weakness if broken).
What happened: BTC corrected sharply after hitting ~$58,800, dropping toward the 61.8% level near $48,400. Price found strong support there — forming bullish candlestick patterns (e.g., hammer or bullish engulfing) with increasing volume, confirming buyer defense.
Trade setup (typical high-probability play):
• Entry: Long around $48,400–$48,600 (at/near 61.8% level) after confirmation (e.g., close above prior candle high + volume spike).
• Stop-loss: Below the swing low or 78.6% level (~$45,000–$46,000) for risk control (e.g., 4–6% below entry).
• Targets: Initial take-profit at prior high (~$58,800), then extensions (e.g., 127.2% or 161.8% of the full move for bigger runners). This setup offered ~4:1 reward-to-risk as BTC rebounded strongly back toward $58,800+ and continued higher.
This example highlights why the 61.8% golden zone (often 50%–61.8% confluence) is a favorite for “buy the dip” in uptrends — price respected it precisely before resuming the bull trend.
Visual examples (charts showing similar BTC or general setups with levels drawn):
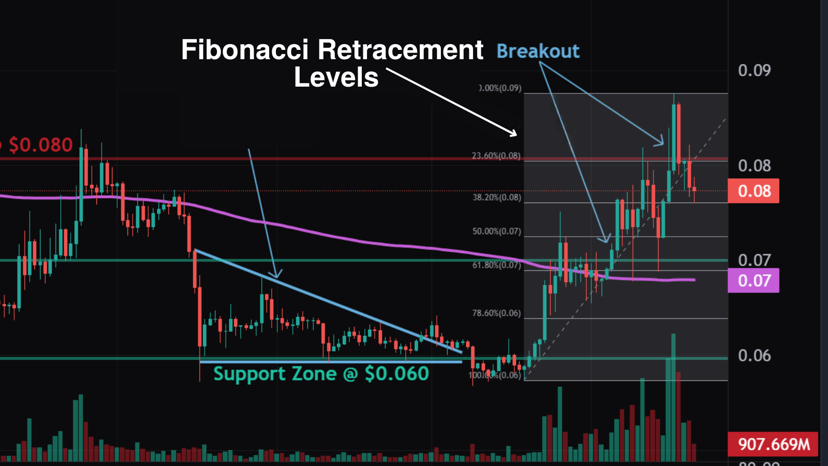
Key takeaway: In trending markets, wait for pullbacks to 38.2%–61.8% zones, seek confluence (candlesticks like hammers/engulfing from our earlier chat, volume, support lines), and manage risk tightly. Fibs are self-fulfilling — millions watch these levels — but never trade them alone!