After delivering an explosive 66% move, PHA/USDT is now entering a critical phase where traders are deciding:
👉 Is the rally finished… or just preparing for the next leg up?
Let’s analyze the 1-Hour timeframe structure step by step.
📊 Market Structure Overview (1H)
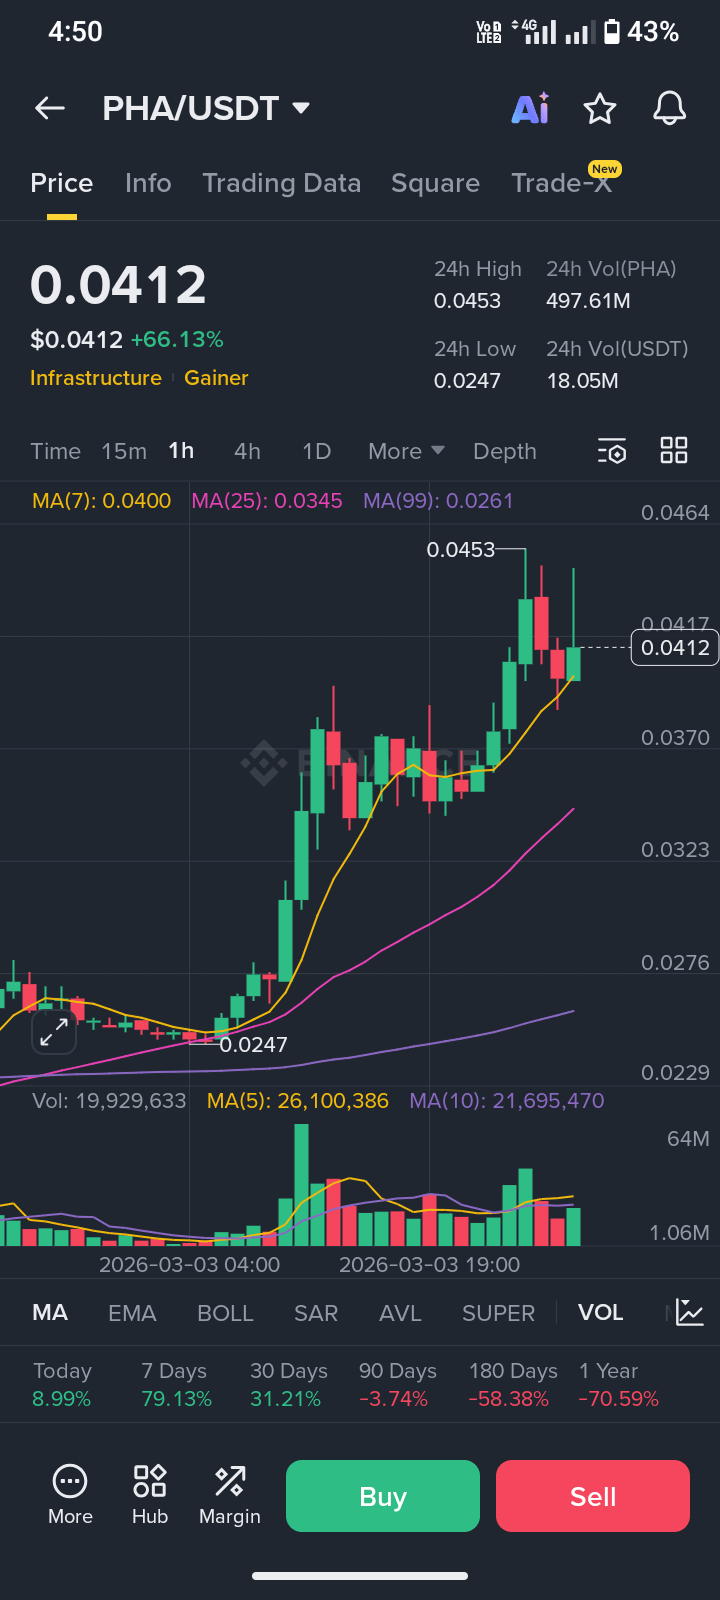
PHA recently pushed toward a local high near $0.0453, supported by strong buying volume and aggressive momentum.
Currently, price is consolidating around $0.041, which is a healthy sign after a sharp pump.
Key bullish signals visible:
✅ Price holding above short-term moving averages
✅ Higher highs & higher lows structure intact
✅ Strong volume expansion during breakout
✅ No bearish trend shift yet
This type of movement usually represents trend continuation consolidation, not immediate reversal.
🧠 Market Behavior Insight
Strong rallies rarely move straight up forever.
Markets typically follow:
Impulse Move → Pullback → Continuation
PHA appears to be forming a controlled pullback where stronger buyers may re-enter positions while weak hands exit after the pump.
As long as support holds, bullish momentum remains valid.
🎯 Advanced Trade Setup
✅ Potential Long Entry Zone
$0.0395 – $0.0410
(Area where buyers previously stepped in)
🎯 Take Profit Targets
TP1: $0.0445
TP2: $0.0480
TP3: $0.0520
🛑 Stop Loss
$0.0375
Break below this level may invalidate bullish structure.
⚠️ Risk Management
After large percentage moves, volatility increases significantly.
✔ Avoid chasing green candles
✔ Prefer pullback entries
✔ Always manage risk
✔ Use stop loss protection
Patience often separates profitable traders from emotional traders.
📍 What Traders Should Watch
If PHA successfully holds above $0.040 support, continuation toward new highs becomes increasingly likely.
A breakdown below support may lead to deeper cooling before the next trend move.
Are you entering PHA on pullback or waiting for confirmation?
#PHA #CryptoTrading #Altcoins #BinanceSquare #TradeSetup